Chapter 1: Ultimate Day Trading Guide
Purpose of the lesson: We’ll begin the process of explaining the market and how you should think about it.
“I would write down observations and think about them. I thought about everything I was doing.”
– Richard Dennis
Before we get started, a brief note about study habits. Until you reach a point where you’re physically engaging in the practice of trading, we encourage you to take notes as you read the following lessons.
We know it can seem silly to write things down for no immediately apparent reason, but if you think you’re learning everything without doing so, you’re robbing yourself. You’re on the learning the day trading learning curve now. That learning curve ends when you’re comfortably taking money out of the market on a regular basis. Between now and then, you will be making mistakes, some that cost you money and some that don’t. The more quickly you get beyond your misunderstandings of the way things work, the fewer mistakes you’ll still be making once you’ve moved into the territory of costly errors. So just write things down and review them. Ask yourself questions, and when you do, even though you don’t realize it yet, you’re already saving money.
So step one is get yourself a notebook and a pen.
1. Greed and Day Trading
“All through time, people have basically acted and reacted the same way in the market as a result of: greed, fear, ignorance, and hope.”
– Jesse Livermore
For most Americans of a certain age, any mention of any Wall St. activity instantly calls to mind Michael Douglas’s performance as the ruthless, unrepentantly greed-driven Gordon Gekko in Oliver Stone’s Wall Street, and perhaps no other figure has been more responsible for influencing popular conception of the entire finance industry. If you’re fortunate enough to be too young to remember Wall St., the words “day trading” might call to mind Leonardo DiCaprio in Wolf of Wall Street—even though Jordan Belfort was, for most of that film, running a penny stock scam not engaging in day trading.
These films contribute to our sense of what we think of stock brokers and day traders, and the picture they paint isn’t a pretty one. But those films deal with extremes because the market is typically, in reality, is too complex to even fully conceive of, let alone rig to one’s advantage.
The thing those films get right are the themes of greed and high-stakes risk. Those are very real, even when you’re sitting comfortably in an air-conditioned home office in a sleepy suburb. …
When Gordon Gekko described greed as “good,” saying it “clarifies and cuts through to the essence of the evolutionary spirit” he’s indulging in a bit of lyrical provocation, but he’s pointing to a human reality. The vices and pitfalls of the finance industry portrayed in those films, the moralizing about the danger of excess, they aren’t a fiction. But neither are they wrong in presenting the excitement and potential of trading, the limitless possibility of forging a way toward a better life. Greed and excess, along with fear and self-delusion, are some of the most formidable obstacles standing in the way of success for most traders.
2. Your Personality Impacts Your Trading Style
“You can’t control what the market does, but you can control your reaction to the market. I examine what I do all the time. That’s what trading is all about.”
– Steven Cohen
If you’ve just purchased a course on the first steps you need to take toward becoming a day trader, you’re clearly not yet at the point where the deep problems of pride and greed are threatening. You’ve made one great decision; hopefully, it’s one of a great number of great decisions you’re going to be making in the next few years. Right now, your concern is with acquiring basic knowledge of the market and how it functions. Once you have that basic knowledge, you’ll begin the hard work of slowly transforming yourself into a hideous, avaricious monster, jettisoning your last few shreds of humanity as you recklessly spend your money on a series of ever-bigger boats ballasted by useless diamond-encrusted gewgaws, even though you don’t need any of these boats in a landlocked state like Wyoming, and you’ve always found diamonds gaudy, frankly.
With any luck, you’ll be able to avoid that unfortunate fate.
In the meantime, there are important questions of character that you need to reflect on so that you can choose the mode of trading that best fits you. Honest self-understanding is essential to achieving true success as a trader…
- Are you a conservative personality who likes to take things slow and patiently build profit?
- Are you a freewheeling type who likes to take risks and reap the greater rewards instantly?
- Are you an adrenaline junky do you like to feel in control?
- Are you intuitive or do you like to study up before you make decisions?
Again— asking yourself questions like these and WRITING DOWN your thoughts might feel goofy, but we promise this stage is the phase that feels most like therapy, and you’ll never have to divulge your weird, disgusting dreams at any point. We’re not interested.
Later on, if the universe isn’t raining yachts full of jewels on you, you might discover yourself to be holding a misconception about who you are. Maybe you fancy yourself a thrill-seeking daredevil when your personality might actually be that of a totalitarian control freak, and your personality expresses itself in its encounter with the market as a perverse delight in exercising control over perfectly executed entry and exit points. Or maybe you’ve always been an over-cautious wallflower, but after a couple years building confidence as a trader you discover a taste for the speed and profit of scalp and shorting plays.
The important thing is to begin this process with an awareness of self, of what the tendencies of your personality are and where your strengths and weaknesses lie, and to stay aware of them as you develop your skill set. Your personality dictates the nature of the trades you will feel comfortable executing and can serve as a better guide than any course you might read, no matter how charming and witty.
3. Executing on Your Plan
“Bulls make money, bears make money, pigs get slaughtered.”
The days of traders on the floor spitting on each other, kicking each other, stabbing each other with pens—those days are ending. But that doesn’t mean the market has become a friendly place. The Internet might allow you the luxury of sitting in your idyllic home or WeWork office, safely outside of the stabbing reach of your fellow traders, but the intensity is still very real.
Don’t make the mistake of thinking that countering the negative forces of greed and fear by simply adopting a positive mindset will counter the negative forces of greed and fear. This isn’t Woodstock. Or maybe it is Woodstock, but Woodstock ’99 after the portable toilets started overflowing. If you insist this has to be Woodstock, it’s that one.
For a trader, an overdose of faith or hope can be just as poisonous and greed and fear. Positive emotions can cloud your vision or delay response time when you need to act quickly to move out of a trade when the market suddenly changes. Traders who hold a stock with a stubborn faith that the stock’s value will bounce back discover exactly how dangerous persistence and delusional positive vibes can be, and the lessons can be painful.
The reality is that the market is an amoral space, and the issue with greed isn’t that it’s wrong—which in the real world it is by definition—but that it can cost you money. And optimism isn’t good, though it can sustain you at a time when it’s called for. They are both states of being that you need to identify and maintain control of.
There are plenty of other resources for investigating concepts like “mindfulness,” and we’re not going to go into them, but the principals of those approaches can be very useful when it comes to trading. Greed can be mitigated by adopting simple practices such as trading small lot sizes and resisting the temptation to jump in too quickly when a stock starts screaming up the chart, which can take more self-discipline than you might think.
Trust your research and stick to your plan. You don’t have to knock it out of the park every time. But when you’re making consistent gains, there will be a temptation to risk more, and overconfidence can be dangerous in those moments. If you feel like you’re missing out on bigger gains you could be making, return to your analysis. Reevaluate your strategy. If you’re going to decide to risk more, take time making the decision. You’ll be happier (and wealthier) with the results (and your slightly bigger boat full of jewels).
4. Characteristics of Good Day Traders
A quick distinction: We’ll be talking about trading in this course, which isn’t the same as investing. A trader’s concern is with trends in the market as well as a particular stock’s behavior, which is a different framework than the one used by investors, who are concerned with identifying stocks that will outperform the market and profiting from dividends or holding stocks over the long-term and selling for a profit large enough to justify the time.
Good traders, in a nutshell:
- They are capable changing their mind, and doing so quickly.
- They can multitask effectively.
- They are intuitive.
- They are emotionally disciplined.
- They don’t trade in negative emotional states.
- They understand what a healthy level of self-congratulation is.
You might not be all of those things, but none of these are beyond learning and developing in yourself. The internet is filthy with people doling out advice about categories of self-development like intuition and multitasking. Some are good, some are moronic, and some are just people for whom blogging about success from their parents’ basement is the only therapy they can afford.
Some of these things will come naturally with experience, but again, it’s best to be conscious of these things and work on them the way you would develop any other skill, by breaking down the process into its component parts and exercising each piece individually and concentrating on the elements that are working (or not) and tackling those that aren’t head on. Develop your sense of the market and then of certain stocks in particular. First learn to see events as they are, and then craft an approach for examining successes and failures.
We’re sure you’re eager to get into the details of trading and build your understanding and buy a tiny boat with barely any jewels in it just to tell your friends you have one, but it’s incredibly important to emphasize that a good trader stays focused on the longer game, and the longer game is all about mentality. Mentality is paramount. It is what separates success stories from failures.
Here’s what some of the greatest traders of all time have had to say about the importance of the mental and emotional components of trading:
Jesse Livermore. Shorted the Wall St. crash of 1929 and made $100 million.
“Emotional control is the most essential factor in playing the market. Never lose control of your emotions when the market moves against you. Don’t get too confident over your wins or too despondent over your losses.”
George Soros. Shorted $10b-worth of British pounds and made $1b.
“I’m only rich because I know when I’m wrong…I basically have survived by recognizing my mistakes.”
“Once we realize that imperfect understanding is the human condition there is no shame in being wrong, only in failing to correct our mistakes.”
Richard Dennis. A commodities speculator who turned a $1,600 loan into $200 million in ten years.
“The key is consistency and discipline. Almost anybody can make up a list of rules that are 80% as good as what we taught. What they can’t do is give people the confidence to stick to those rules even when things are going bad.”
“When you have a destabilizing loss, get out, go home, take a nap, do something, but put a little time between that and your next decision.”
Paul Tudor Jones. Tripled his money by predicting Black Monday in 1987 and shorting it.
“The secret to being successful from a trading perspective is to have an indefatigable and an undying and unquenchable thirst for information and knowledge.”
“At the end of the day, the most important thing is how good are you at risk control.”
“Don’t be a hero. Don’t have an ego. Always question yourself and your ability. Don’t ever feel that you are very good. The second you do, you are dead.”
“Failure was a key element to my life’s journey.”
“Where you want to be is always in control, never wishing, always trading, and always, first and foremost protecting your butt.”
John Paulson. An investor worth who was worth $8.6b in 2016.
“Our goal is not to outperform all the time – that’s not possible. We want to outperform over time.”
David Tepper. Personally made $4b in 2009 running a hedge fund.
“I’m rubbing your balls for good luck!”
Thanks, David, and good luck. A spirit of generosity never hurts.
To be capable of the kind of depth and detachment of focus necessary to succeed at the highest rate takes time. No one is is a natural, so remain conscious of developing the ability to focus as a primary goal and you will do well.
Take responsibility for your mistakes. Learn from them. Your mistakes are particular to you and your ability to identify and understand them as quickly as possible defines the individual path to succeeding that you need to take.
5. The two inviolable tenets of good trading.
- Protect your principal. When you’re trading, it’s easy to get swept up in the moment and forget that at the end of the day, the only thing that matters is the dollar amount in your account.
- Trade well, not to win. By the end of this course, you’ll have a picture of what the fundamentals of sound trade planning and execution look like, but your mentality and behavior should reflect the reality that planning and execution are the only things that matter. You won’t always win; you only need to win more than you lose. Understand what is working and what isn’t, and success will follow.
6. Full-Time vs. Part-Time Day Trader
Your first decision is whether you want to be a full-time trader or not.
If you’re making three or fewer trades throughout the course of a single trading day, or you stick to holding positions for days or weeks at a time, or you’re not necessarily trading as a primary means of income, then you’re considered a part-time trader, which can be done reasonably from a home office.
If you’re trading at market open every day and you’re making more than a handful of trades in a single trading day, or dedicating large chunks of time to analysis, or engaging fast profit-taking trade strategies using precision exits and entry points, with the intention of trading for a living, that’s a full-time trader’s life. You may want to consider renting an office to do this.
7. Tools Needed for Day Trading
To get started you’ll need a few things.
The most important piece of equipment you need is a high-quality computer and more than one monitor. The notion of “too many monitors” doesn’t exist. Can you imagine someone telling you, “This is too many boats, and please be more realistic about the amount of jewels below deck.” No. You can’t. Same goes with monitors. The more you have, the more information you can eventually gulp through your eyes. When you think you have enough monitors, double it. Two is the minimum.
The sky is the limit on internet speed as well. You want as fast a connection as you can find and afford, and reliability is as important, if not more important, than speed.
The actual most important tool you’ll need is an account balance as large as you can afford without threatening your lifestyle. You should never trade with money you cannot afford to lose.
Your monthly expenditures will include software and exchange fees. We recommend you maintain two trade accounts, one for long-term trades and one maintained exclusively for day trading. More on what this means later. You’ll also need research materials, trade newspapers, and magazines.
Other office necessities include a backup internet provider, a television for watching a financial network, a phone line used exclusively for making calls related to trading (a number no one else knows, basically), a window, a clean desk, and all the privacy and zen vibes possible. Maybe some pages torn from a yacht catalogue.
The absence of distractions. Inside your office, one thing should take place: your trading process. Your office isn’t a place for looking at social media websites, doing YouTube deep-dives of natural disaster footage, or shopping for rare precious stones and starter boats on eBay; it’s a place where you trade, and that’s it. You need an environment that enhances focus and starves you of distractions.
8. Preparing to Make Your First Trade
Let’s get started. Here’s an overview of preparing yourself to make your first trade:
Step one.
Read. Read, read, read. Read. Also, read. You’re going to read these lessons, then you’re going to read research materials, and you’re never going to stop. Don’t read to distraction or as a way of procrastinating, but it’s hard to imagine doing too much reading, especially in these period of learning.
Here are some more quotes from luminaries for you, you big reader.:
Paul Tudor Jones. “The secret to being successful from a trading perspective is to have an indefatigable and an undying and unquenchable thirst for information and knowledge.”
JD Livermore. “There is nothing new on Wall Street or in stock speculation. What has happened in the past will happen again, and again, and again. This is because human nature does not change, and it is human emotion, solidly build into human nature, that always gets in the way of human intelligence. Of this I am sure.”
WD Gann. “TIME is the most important factor in determining market movements and by studying the past records of the averages or individual stocks you will be able to prove for yourself that history does repeat and that by knowing the past you can tell the future. There is a definite relation between TIME and PRICE. Now, by a study of the TIME PERIODS and TIME CYCLES you will learn why tops and bottoms are found at certain times and why Resistance Levels are so strong at certain times and bottoms and tops hold around them. The most money is made when fast moves and extreme fluctuations occur at the end of major cycles.”
Step Two.
Get online and explore trading chat rooms. Learn the lingo and find out how people think about trading.
Step Three.
Search out some online trading courses. The one you’re reading right now is great, but there’s no such thing as being over prepared.
Step Four.
(Optional) Attend a “money” show or traders conference.
We realize this will likely be the first item on your budgetary chopping block, but if you can afford to, make an educational vacation out of it.
There are plenty out there, and while your mileage may vary, it’s a great way to immerse yourself in an environment dedicated to trade, to converse and connect with people who share your interests, to ask experts questions, to get a feel for the industry. This is especially helpful if you’re planning on trading out of a home office. Exchanging notes with your peers, becoming conversant in the ideas and practices of the industry— these things reinforce what might otherwise remain abstract theory.
You might have an understanding of an idea, but that doesn’t necessarily make you conversant on the subject, and that’s what your goal should be. Bounce your misconceptions off of experts and peers, and you’ll reinforce what you know and purge yourself of misunderstandings that might cost you money later.
Anyone who has suffered the pain of raising a hand in class only to discover the immaculately conceived notion in your head doesn’t readily present itself as eloquently as you expected, if it indeed exists at all, understands that if you don’t have the precise words for your thoughts, you don’t really have the thoughts at all. It’s easy to hear someone explain something and indulge yourself in the fantasy that you too are as eloquent as they, but guess what. You’re wrong.
Surrounding yourself with people who know as much or more than you for a day or two is a great way to test your understanding and debug your understanding.
Attending a conference can be most inexpensive way to build confidence. The lessons you learn this way save you the more costly lessons that happen during your first year of trading. Minimize those by reading and talking and reading and paper trading and talking and reading.
We only belabor this point because this is a kind of self-deceit closely akin to the fantasies of prowess and trade acumen that can cloud your vision later on. Talk. Read and talk. Read and talk and paper trade. Lather, rinse, repeat.
What is paper trading? It’s the real deal, as close an approximation to a day of trading as you can muster, minus the essential ingredient of trading: emotional control. You’ll be sitting at your desk, watching your chosen stock throughout the day, writing down all the hypothetical moves you would make, but you won’t actually click the button.
And when you’re ready, brace yourself. As familiar with the process as you may be, as ready as you may feel, as much money as you believe yourself to have missed out on while paper trading rather than doing it for real (you’re wrong about that), there are going to be some bumps along the way.
Step Five.
Establishing your two-account system.
If you’ve decided your aim is to become a full-time trader, we highly recommend you open two trading accounts that you use exclusively for different purposes. One will be an account with an online discount broker, used for making longer-term trades on the New York Stock Exchange (NYSE), and the other will be a direct-access trading platform, which you’ll use to make shorter-term trades on the Nasdaq.
Online broker
When you’re shopping around for an online broker, you’re looking for: reasonable commission rates, an accessible and easy-to-navigate website that doesn’t experience lag when you switch from screen to screen, a well-organized screen, and built-in protections against making data-entry errors. You want a quick confirmation system, real-time portfolio updates, and account balances. Comprehensive and accessible research data are important.
You absolutely MUST have alternative means of contacting the broker in case of an emergency.
Shop around for the lowest possible margin rates. There’s quite a range of them out there, so you don’t want to accept the first price you find. Also, if the broker requires a minimum dollar amount to open an account, the lower the better, obviously.
You get what you pay for with, generally. Discount brokerages typically don’t offer advice, while a more full-service brokerage will offer highly personalized service.
Direct-access trading platforms
Level II provides you with a real-time trading platform that lets you see the quotations of individual market makers registered in every Nasdaq-listed security as well as the offers and bids on lots. These platforms include order entry screens, giving you access to make trades with other clients directly via electronic communications networks (ECNS). The screens display all the market participants for a selected stock, granting you more transparency.

Exchange names and market makers representing brokers are also found on these screens. We’ll dig in further on how to interpret all this data later.
9. Looking at the market with your MIND’S eye, man.
The market is.
It cannot be wrong.
Heavy stuff, especially when you’re on A LOT of mushrooms. This isn’t an endorsement, but if you ever trade after taking psilocybin mushrooms, please write us and know and claim your free month’s membership.
In microcosm and macrocosm, the market represents a collective response in the world. On the smallest scale, the price of a stock moves up and down in tiny increments as the result of tens, hundreds, and sometimes thousands of people making decisions about what direction a price is going to move. On the broadest scale, events are happening in the world that are leading people to come to the contradicting conclusions that result in an agreement on the value of something.
For a moment, two traders agree on a price but disagree on the real value of a stock, and then reality decides who was correct about which direction it was headed. The connection between the two is something like the Butterfly Effect, small, insignificant-seeming events causally echoing out across the globe, rippling outward in an irreversible chain of events. If you weren’t feeling those mushrooms before, I bet you are now.
Sensitivity to market fluctuations, the ability to comprehend and feel the flow of what you’re seeing on your screen, the shifting of your inner chi caused by the market rhythms you’ve internalized, the understanding of the psychology of the market: these things are what will ultimately bring you success. But for now, use your head and not your heart.
Another heavy, tripped-out thing about the market is its limitlessness. Exchanges open and close, but the market never sleeps. Like they used to say about the British Empire, the sun never sets on the market (or their diamond-saddled naval fleet).
10. Watching the news.
Paying attention to financial news is crucial, but maybe not in the way you might expect. If you think traders sit around watching CNBC or Bloomberg waiting to jump on any big news being announced and react to it like a school of piranhas feeding on a soaring or dying stock, you’r wrong. Traders don’t do that. Smart traders know that anything you’re watching on a television screen has most likely been leaked or shared over professional news networks some time ago, enough time that the stock might have already undergone heavy buying or selling and essentially absorbed the news. Traders who already own the stock are more likely to use the upswing following an announcement of good news to sell the stock at a price momentarily elevated by the misconception among some traders we mentioned as inaccurate.
Any of the major networks are good: Bloomberg, CNBC, Fox Business. Find one the one that suits your taste or political affiliation or masochistic cravings for self-abuse. It’s your world.
What you’re trying to do is take the temperature of the market, watching the particulars but focusing on the big picture.
Chapter Two: Ultimate Day Trading Guide
Purpose of the lesson: We’ll start with a broad, 30,000-ft. view of the major markets in the U.S., define a few terms you’ll need to know, and introduce you to basic chart information.
1. NYSE vs. Nasdaq vs. AMEX
NYSE
The New York Stock Exchange (NYSE), sometimes referred to as “the big board,” is the largest equities-based exchange in the world according to total market capitalization of its listed securities, US$19.3 trillion as of June 2016. Electronic systems have largely taken over the NYSE, and all orders from around the globe arrive on the floor electronically now, though there are still floor traders in New York.
The exchange is nearly as old as the United States itself. The Buttonwood Agreement was signed by 24 traders on May 17, 1792, establishing the NYSE. There were five securities then. Since around 1997, about a billion shares have been traded daily.
We use the term “listed” to describe the stocks traded on the NYSE. The symbols used to denote stocks being traded are from one to three letters long.
It’s open Monday through Friday from 9:30a EST to 4:00p EST.
The Dow Jones Industrial Average, or “The Dow,” is a price-weighted average of 30 listed NYSE stocks (as well as a handful on the Nasdaq) chosen for their perceived representation of the economy as a whole. No indicator in the world is more closely watched than the Dow. The Dow can be bought and sold in a single stock called an exchange traded fund, or ETF. Similar averages for different sectors of the economy, such as the Dow Jones 20 Transportation and Dow Jones 15 Utilities, are also closely watched.
The NYSE Composite Index reflects the movement of all stock prices—over 1,900 stocks—on the NYSE. As with the Dow, stock value is weighted according to market cap. Listed stocks are generally considered less volatile than those on Nasdaq and this perceived reasonableness makes the entry points easier to catch, but that’s for a later lecture.
The individual facilitating trade on the NYSE is called a specialist. They act as an auctioneer maintaining order and reporting all bids and asks, an agent transacting limit orders place by investors through brokers, a catalyst inducing trades when bids and asks can’t otherwise be matched, and a principal buying and selling in order to stabilize an unruly market.
Their counterpart in the Nasdaq is referred to as a market maker. Unlike specialists, market makers aren’t actually at the exchange. They work at large investment companies and maintain the inventories there, buying and selling their stock individuals and other dealers. They give two-sided quotes with both bid and ask prices. On average, there are 14 market makers for each stock, providing liquidity to the stock.
What is the Nasdaq?
Nasdaq
The National Association of Securities Dealers Automated Quatron (NASDAQ) is a securities marketplace created by the National Association of Securities Dealers in order to enable rapid trade on a transparent computerized system. It is the largest fully electronic stock market in the US, with almost 3,300 listed companies, and it is a benchmark index for U.S technology stocks, including Apple, Amazon, Microsoft, et al. The symbols have four or fewer letters, for example, AAPL, AMZN, GOOG, and MSFT.
Tech stocks tend to move in tandem, so when there’s a “tech wreck,” they can be nasty, dragging the entire Nasdaq down with it.
Like the NYSE, the Nasdaq exchange itself is a publicly traded company under the symbol NDAQ.
The Nasdaq’s analog of the Dow is called the Nasdaq 100 lists the top 100 of non financial stocks in the market and can be traded as a single stock, the QQQ. The NASDAQ Composite comprises all issues traded on the exchange.
Because it is more volatile than the NYSE, we recommend you start there and work your way over here.
American Stock Exchange (AMEX)
The American Stock Exchange, or AMEX, lists equities, options, and electronically traded funds. Like with the NYSE, specialists maintain these markets with electronic systems. Also like with the NYSE, symbols have three letters.
The Amex Composite includes all stocks listed on the AMEX.
We’re not going to deal with this one at all. Just wanted to confirm that it exists.
Moving on!
2. Important Day Trading Terms
We’re only going to tell you what we think is absolutely essential about these ideas. You can go pretty deep on some of these concepts, and we encourage you to do so later on if it interests you, but for our purposes, here’s what you need to know.
Shares and Stock
Shares and stock are the same thing: ownership of a piece of a company. Bonds are corporate IOUs. All of the above are securities. There’s a chance you find the offering of this information as insultingly basic, but there it is regardless.
Supply and Demand
Supply and demand. These are perhaps the most fundamental concepts in all of economics, and they are the absolute heart of a market economy. They are the actors in the story you are watching when you’re looking at your screen. Supply is how much of a product a market can offer. Demand refers to how much of a product is being sought by buyers. Quantity demanded is how much product people are willing to pay a certain price for. The demand relationship is the relationship between price and quantity.
Price
Price represents a shared opinion of value at the moment of transaction. The disagreement is in each individual’s belief about where the price is headed. Being the one whose belief proves to be true more often than it proves to be untrue is headed more often than you fail to is the name of the game.
Stock Ask and Bid
The ask and the bid. The inside bid is the highest price you’re allowed to demand when selling a stock as a market order. The inside ask or inside offer is the lowest price at which you can by a stock if you want to buy at the market price. The spread is the difference between those two prices. These numbers appear as bid first like this: “Bid: 22.87, Ask: 22.88.”
Decimalization
Decimalization refers to the market adopting the use of decimals rather than fractions of a dollar. Before April 9, 2001, the smallest fraction allowed was 1/16, so the smallest tick in price was $0.0635, and since then, the smallest movement a price could make, it’s been $0.01. This changed the nature of market making by trimming the fat on the distance between the bid and ask prices.
Market Order and Unrestricted Order
A market order or unrestricted order is an order an investor makes through a broker or brokerage service to buy or sell at the best available current price. It doesn’t contain any restrictions on price or time frame, so this is the default option and the most likely to be filled. But this increased likelihood can come at a price.
Slippage
Slippage refers to the difference between the expected price of a trade and the price when it’s actually executed. This is most common during periods of higher volatility and on securities with low liquidity and wide spreads. It also happens when large orders are being executed and there isn’t enough interest at the desired price level to maintain that expected price, so the price is lowered in order to meet the new level of interest. Slippage can be a positive or negative movement—it refers to ANY difference between expectation and actual price at the moment of transaction.
If a stock is quoted at a bid/ask of $30/31, with 100 shares at the bid and 100 shares at the ask, and a trader places an order to buy 200 shares, the first 100 shares will be executed at the ask ($31), and the remaining 100 shares will be executed at whatever the ask prices are for the sellers of the next 100 shares listed at the ask price. This moves the average price for the 200-share order up, and the difference in price is the slippage.
Slippage should give you some idea as to how quickly prices change. We aren’t talking about trades being executed minutes later; this happens in seconds, even fractions of a second.
The best way to avoid being hurt by slippage is to avoid market orders whenever they aren’t really necessary, opting instead for limit orders.
Limit Orders
A limit order is a take-profit order placed with a broker to buy or sell a set amount of a security at a specified price or better. There’s a possibility it may not be executed if the price you set cannot be met during the period of time the order is left open for. The length of time an order is left outstanding before cancellation is also up to you.
If a stock is trading at $20 and you want to buy at $18, you can place a limit order and your order will be filled when the stock reaches $18. If you own a stock trading at $20 and you want to sell at $22, you place a limit order to do so and the order is executed if and when the price is met.
Limit orders guarantee a trade will be made at a particular price, but it’s likely your brokerage will charge you more in commission fees for the privilege, and your order might not be executed at all if your set price isn’t reached. Execution is not guaranteed, but you won’t miss the opportunity to buy or sell at the target price point if it is dealt in the market.
Stop Loss Orders
Contrast limit orders with stop loss orders. These ensure that a transaction will be executed only when price falls to a particular amount, at which point stop orders essentially become market orders.
They can also be used as sort of a safety net for profits you’ve made. If you purchase stock at $50 and it reaches $60, setting a stop loss at $55 will prevent your gains from being wiped out entirely should the price fall back to $50 or worse. These are handy if you’re not able to monitor the stocks closely.
Broker Commission
A commission is a service charge paid to a broker in return for handling the purchase or sale of a security. This is how full-service brokerages make the majority of their profits. The rates vary widely from brokerage to brokerage. If you’ve ever seen Trading Places starring Eddie Murphy, this is basically the ONLY part of trading the old brokers explain to him about commodities before he makes a fortune. Sadly, it’s much more complicated than that.
Commissions differ from fees in that a fee is a flat rate, whether a dollar amount or percentage of assets under management (AUM), whereas a commission is paid based on selling investment products like funds an annuities. The possibilities for conflicting interest here is obvious.
Trading on Margin
Margin is a term used to refer to a few different things, but for our purposes, we’ll be using it to refer to a loan a broker gives you.
When you open your an account with a broker, designate it as a margin account (usually referred to as a “50% margin account”). The broker will match the funds in your account. If you start with $5,000, they will match you, effectively giving you $10,000 to work with.
Don’t get too excited. Don’t get excited at all, really, ever. This is a good place to start learning emotional discipline. You need to be careful with these margin accounts. Forget this money even exists until you’ve got enough experience to handle it, which won’t be for a while.
Quick, very important aside: If you plan to make four round trips or more during a five-day trading period, the SEC requires you keep a $25,000 minimum balance in your account. You’ll be starting slowly, so you might not need this right away, but four entries and exits in five days isn’t very many, so you need to budget for either slowly working your way up to this or starting out with this much right away.
Gap
A gap is a break in a stock’s chart occurring when the price of a stock moves suddenly in either direction without any trading occurring. This can be due to a buying or selling spree, or an earning announcement, some sort of news release, or a change in analyst outlook.
This commonly happens from day to day. Stocks don’t necessarily close one day and open at the same price the next. Market makers and specialists adjust the price according to the orders waiting to be filled when the market opens.
Price is sensitive to human opinion and emotions, and whether or not a particular market is open, the forces acting on price never stop. An experienced trader can exploit these gaps and take quick profits off price corrections, but open gap trading isn’t a game for novice investors.
3. Fundamental Analysis vs. Technical Analysis
Analysis
There are two basic methodologies for selecting stocks.
The first is fundamental analysis, which is used for longer-term investments. The crux of this method is to discern the intrinsic value of a stock, as opposed to predicting which direction the price will head next. Fundamental analysis might lead you to believe a stock is undervalued, but the price might still drop, and you could still prove to be right later on down the road. When you’re making these determinations, you take into consideration the big picture: the overall economy, industry conditions, the financial condition of the company, and the quality of its management. You want to look at the data over the course of years rather than digging into the minutiae of current market conditions.
The information you’re looking at will includes statistic such as stock’s annual growth rate, the five-year, one-year, and quarterly earnings records, and P/E ratios.
The aim is a big payoff months or years down the road, so steady, conservative growth is what you’re looking for.
Fundamental analysis can also be useful for day traders, but it is vert time consuming and so in many cases will not be worthwhile. For that reason, it isn’t nearly as important for our purposes as technical analysis, so we won’t be focusing on it. Later, when you’re rolling in dough, you can read our upcoming course on investment and learn and laugh and wonder how it ever was you managed your former benighted life of stupid ignorance. It will be embarrassing, but you’ll find satisfaction in having grown.
If you’re interested in doing some fundamental analysis right now, the proprietary rankings in Investor’s Business Daily (IBD) stock tables are very useful. Find industry groups either in an uptrend or breaking into one on their daily and weekly charts. Then focus in on component stocks that look promising. From this small group, look at the IBD stock tables to see if any are ranking in the top 70, meaning the fundamentals are good. You’re already starting to think like a trader!
The points of emphasis when you’re doing technical analysis are different. Time of day, price, and market sentiment are all key here. Your primary tool—get excited, because we’re about to really dig in!—is the chart. Doesn’t sound thrilling, but you’re wrong. Charts are your life now.
What you’re looking at is the history of the stock, the story of how people have felt about it and valued it as a consequence. Practice will bring speed in breaking down what you need to know about a stock, and eventually you’ll be able to do technical analysis in seconds. When you can breakdown quickly, you can break down more frequently and improve accuracy in your assesments. When you break down more stocks at greater accuracy more frequently, the deeper your understanding of the psychology and behavior of a given stock will become. Patterns of behavior will emerge, and these patterns will shape your own thinking and trading behavior. The ultimate aim is for your own thinking to mirror the psychology of the stock itself. The closer the resemblance, the better your win percentage.
4. Trade time frames
When we say position, it can refer to the amount of a security that is owned in a general way, but we’ll more frequently be using the term in the context of a position trade, meaning a stock purchase with a view to following intermediate-term trends that last from months to years, ignoring small price fluctuations.
Swing Trades
Swing trades, the next rung down the timescale ladder, last somewhere from overnight to several weeks. Obviously, the terms here aren’t neatly delineated, but what we’re targeting with swing trades are the swings, or fluctuations, in price that make up the intermediate trends you would be trying to following in a position trade. It’s like zooming in another level of resolution. These are best advised during bullish markets.
Consider these time frames with respect to your personality, and eventually, as you develop the sense of which ones are right for you, and if you like them all, when the right time to apply each strategy is. Alongside your personal preferences, the choice between position and swing trading is based on what you see happening in the market. If a strong trend is developing and carries a stock higher, that’s a good scenario for a longer position trade. If a stock is moving sideways over longer-term frames, then you could shift to the technical analysis, swing trade side of your brain and move in and out of the stock accordingly.
Day or Intraday Trades
Day or intraday trades are bought and sold on the same day. This is the most common type of trade. Day trading is made difficult by several hurdles: by the bid-ask spread, by commissions, and by the fees associated with keeping yourself informed up-to-the-second. You need a good deal of experience to master the techniques required to thrive as a day trader.
Momentum trading is when you find a stock making a significant move in one direction or the other with high volume and move in and out quickly with the hope that the momentum will continue to drive the price for the duration of your trade. A scalper is a trader who does this dozens, even hundreds, of times per day, sometimes for only a matter of seconds, trying to “scalp” a tiny profit by exploiting the bid-ask spread.
5. Daily market schedule (all times EST).
8a – 930a Pre-market. Some direct-access trading platforms allow trading as early as 4a. You don’t need to participate, but it never hurts to look at the activity and get a sense of what the day might be like. Although, that being said, looks can be deceiving. Because volume and liquidity will be lower, and the bid-ask spreads can be larger, the view you get is somewhat distorted.
930a Equities market opens. Real volume rushes in.
945a -1010a First reversal period. The momentum of the morning rush can peter out.
1130a The lunchtime slowdown has likely begun, even on an active trade day.
Noonish It’s time for a nap. For real. Twenty minutes of sleep will keep you sharp for the second half of the day. At least get out of your office and, if possible, outside for some fresh air.
1:30p Trading starts to pick up again for the afternoon session. Get back in your chair.
2:30p Stocks break out (or down) more definitively
3:00p Treasury bonds stop trading, possibly shifting the direction of market action.
3:30p Afternoon reversal is possible around this time and continue to be possible until the end of the day as more positions close.
4:00p Equities market close
6. Three Qualities to Look for in a Stock
The three primary qualities you’re looking for in a stock are:
High liquidity. Because strong volume is the most important factor in selecting stock, we’ll talk about this in greater detail throughout the course, but the story in a nutshell is that the lower the liquidity, the more difficult it is to execute precise movements in and out of the stock.
Medium volatility. You don’t want price changing more than 5% on an average day. You want the stock to be active but not out of control. High volatility is often reflected in low liquidity levels, because traders shy away from high-volatility stocks.
Herd mentality. Traders generally prefer for a stock’s price movement to correlate with those of its fellow industry group members. This makes them more predictable.
For more detailed information, traders often use a stock screener like Zacks, Finviz, or Google Finance. These allow you to find high probability set-ups by screening stocks according to price, market capitalization, P/E ratio, etc. They’re most commonly used for long-term investing, but can be helpful in developing a sense of a stock’s personality.
7. Charts and Techniques
Here we go! Charts! Remember how much you love them?
There are three kinds.
Line Charts
Line charts are drawn by taking the closing price of designated periods of time throughout the course of the day, week, month, or whatever. They’re great for looking at the big picture.

Bar Charts
Bar charts offer a little more information than line charts. The vertical bar shows the price range for the designated time period, highest price at top and lowest price at bottom, naturally. The horizontal bar on the left shows you what the opening price was; the horizontal bar on the right shows you the closing price.

Candlestick Charts
Candlestick charts offer information similar to the bar chart, but they’re more popular because most people find them easier to look at. The vertical rectangle indicates the opening and closing prices. A clear body indicates the price closed higher, and a dark body means the price closed lower. The lines extending from the top and/or bottom of the rectangle are called shadows, and they indicate the highest or lowest the price reached during the given time period. When a stock closes at the highest point during the period, meaning there is no upper shadow, we call this a shaved head. A shaved bottom is exactly what you would expect, an indication that the stock closed at the lowest price during the period.
These extra details are what sets the candlestick chart apart, making it an essential tool in finding support for your decisions and strategies. These are the best charts to look at if you want to understand market psychology, and our goal is to make your mental picture of the market mirror the actual market as closely as possible, so we’re going to look at candlestick charts and the trend changes discernible through the study of these charts during this course.

7. Candlestick Patterns
The following is a breakdown of the various basic patterns you’ll see on candlestick charts. Keep in mind when you’re looking at each of these that each candle represents the time frame you’ve selected; could be daily, could by hourly, could be 5-min. These patterns all occur at what can be considered different levels of resolution, and you can zoom in and out according what kind of trade you’re hoping to make or what kind of support or resistance you’re trying to find.
Hammer Pattern
A hammer has a shaven head and a clear body. Like this:

The lower shadow should be twice the length of the real body. When the hammer appears at the bottom of a downtrend, it’s a signal that the current movement might be breaking.
Hanging Man Pattern
The hanging man has a shaven head as well, but the real body is dark. Same as the hammer, the lower shadow should be twice the length of the real body. When appearing at the top of an uptrend, it signals that the current movement may be ending. It looks like this:

_______
Engulfing Patterns
An engulfing pattern is a signal consisting of two candlesticks, and it can mean an impending reversal of a major trend. The relative size of the real bodies matter. The latter body needs to “engulf” the former one, meaning the upper and lower boundaries of the second extend beyond those of the first, respectively. And the bodies themselves need to be opposite colors.
A bullish engulfing pattern, a smaller dark body followed by a larger clear one, means a reversal in a downward trend. A bearish engulfing pattern, a smaller clear body followed by a larger dark body, occurs at the reversal of an uptrend.


If the next body formed engulfs the second bod of this pattern, the signal strengthens. Think of it as an amplification.
Dark Clouds
Dark cloud cover is a bearish reversal pattern appearing either at the end of an uptrend or at the end of a period of congestion, or sideways movement.
The signal involves two candlesticks. The first has a substantial clear real body. The second candlestick’s price gaps open above the top of the previous clear body as well as its shadow (if there is one). The second candle closes within the price range of the previous day’s candle, but below the midpoint of it.
The deeper the second body moves into the lower part of the first, the stronger the signal that the bears are taking over.
However, if the dark cloud cover pattern is followed by a substantial clear real body closing above the highs of either candle in the pattern, it suggests the start of another rally.
Piercing Patterns
The bullish piercing pattern is dark cloud cover in reverse, forecasting the reversal of a downtrend.
The first candlestick has a dark body and is part of a falling price move. The second has a clear real body and gaps open lower than the previous candlestick’s low. Then the price jumps back up and the stock price closes further than halfway up the prior candlestick’s body.

If the second real body doesn’t close at least halfway into into the dark body, the signal is negated. If the second, clear real body opens lower than the previous day’s low and closes higher than the previous day’s high, this is considered a key reversal day.
Morning Star Patterns
A star is a three-candlestick formation indicating the price has gapped higher. A small-bodied candle is positioned above the price range of the previous candle, and its real body is small, indicating a strong surge that is now slowing. The bulls and bears are locked in contention for control. The star itself can be dark or clear. Stars warn of a shift in price movement, and they are very powerful warnings.
Evening stars signal the reversal of an uptrend. A long, clear body precedes a small-bodied star, either light or dark. The third candlestick has a dark real body dropping into the lower range of the first candlestick.
Morning stars are the opposite of evening stars, appearing before a downtrend begins. The first two candlesticks are a long dark body followed by a star with a small body, either clear or dark, gapping lower than the previous candle’s close. This indicates that buying pressure has begun, that the bears are losing momentum to the incoming bulls. The third star has a clear body that moves into the price range of the first candle of the pattern.


Doji Candlesticks
Doji candlesticks are created when a stock opens and closes at or near the same price, leaving the real body a thin, insubstantial line. Doji stars are doji that gap either above or below the previous candlestick’s real body. In a trend with strong volume, these are powerful indicators of reversal and need to be respected when they appear. A stalemate has been reached between the bulls and the bears, and the next move will give us the winner, either confirming the reversal or rejecting it.

Evening doji stars warn that the end of an uptrend might be imminent. It gaps open above the clear body prior to it and is followed by a dark body that descends into the light real body of the candlestick formed prior to the evening star. The bears have gained control, and the uptrend is broken. But if the candlestick after the evening doji star has a clear real body, the warning is negated.
Morning doji stars indicate the end of a downtrend. The star gaps open below the dark real body prior to it and is followed by a clear real body opens higher, and the price rises into the area of the black body prior to the morning doji star. The bulls have taken control, and the downtrend is broken. However, this signal is negated if the star is followed by a candlestick with a dark real body.
Shooting Star
A shooting star is a single candle consisting of a small real body, either clear or dark, with a long upper shadow. This occurs at the top of uptrends and warns that the bulls are losing control. The long upper shadow indicates the bears’ increasing strength.
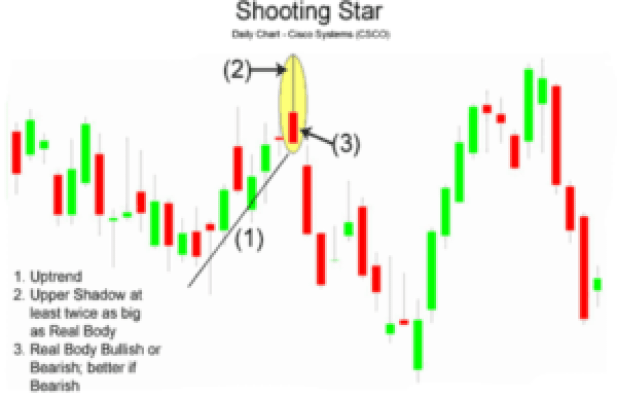
The gravestone doji is shooting star that closes at the low of the day, and it is a bad, bad sign.

8. Trading Ranges
Stock prices move up and down within what’s called a trading range. Most of the time, they move sideways.
Market prices move in cycles. The name of the game is recognizing these cycles. Extended stock cycles sometimes take years to complete. Within a given cycle, smaller cycles take place over the course of months, weeks, and days. Within a single day, miniature cycles evolve. It’s like a fractal blacklight poster you can make money staring at.
The high points are called peaks and the low points are called valleys (or troughs).Stocks have a tendency to fluctuate between higher and lower price areas in a somewhat predictable, “horizontal” channel, what we’ve been referring to as a sideways pattern. What’s happening is that sellers who are shorting the stock when the price is near the top of the range “cover” their short positions (we’ll go into detail later, but for now understand this means they buy the stock back to close the trade) when it nears the bottom, knowing that buyers will be ready to step in the expectation that the price will reverse to higher prices.
There’s plenty of money to be made in playing stocks trading inside an orderly range, buying the dips and selling the rallies. We recommend this be one of the first techniques you develop a skill at.
Uptrends
A breakout is the exact point where a stock rises over the valley. To qualify as a legitimate uptrend, the stock price must make a series of higher highs and higher lows.
Uptrends are fueled by greed and euphoria. We say a stock is overbought at the height of a cycle. At this point, the overbought stock starts to sputter, the volume usually increasing, and the bears gain control and drive the price back down.
An uptrend continues so long as the price doesn’t decisively break through the previous low of the trend. When the barrier of the trend low is broken and the uptrend has officially concluded, it often “rolls over” into a sideways pattern.
Downtrends
Sometimes buyers get tired of watching a stock trade sideways and get out of a stock, and if enough traders do this, eventually there aren’t enough of them to support the price, and that’s when short sellers move in. A downtrend is characterized by lower and lower lows being reached. They are broken when the price once again closes above a prior high.
Disinterest manifests itself as low volume, and this can often be at the root of a downtrend. But if the volume is strong and the price is still dropping, look out. The stock in trouble. Panic has set in and everyone is trying to get rid of the stock. What your eyes see will be a long black candle, but what your mind should see is panic. Short sellers and long-term investors will be the only ones sticking around.
A bull trap is a false signal of a reversal in a downward trend. That’s all. They happen, and they’re frustrating. Heads up.

Bull Trap

Consolidation
When stock dutifully moves sideways in a compact, linear fashion, we call this consolidation. The price range indicated by each candlestick should be short, tight, and orderly. There is a tension here caused by buyers and sellers who are at a relative dead heat. The effect is a compression within the price range that is likely ready to explode in one direction or the other.
Whether you find it on your daily or intraday charts, this is a great pattern to come across. We recommend you focus some attention on finding this pattern in the early stages of your development.
Congestion
During congestion, no upward or downward trend emerges, but neither does the price fall into an orderly consolidation. Buyers and sellers are being indecisive about the whether the price should be higher or lower, so the stock appears to behave erratically. Symptoms of the market illness known as congestion, other than indecisiveness, are unpredictable daily price ranges and gaps opening upside one day and downside the next.
Congestion is bad news. You don’t want any piece of it. When you recognize it, stay on the sidelines and wait for a better moment to enter.
9. Support and Resistance.
Stocks rarely go to zero. Usually, they reach the price of the previous valley and find traders willing to buy the stock at that price there. Why is that?
You need a thorough understanding of the concepts of support and resistance. They are created by human memory, emotion, and the fundamental factors of the market, so they’re a sign of something profoundly deep. They are the first things you should look for when you look at a chart.
To put it briefly, support is the floor of the price a stock is currently trading at. Resistance, or “supply,” is the ceiling.
When a price reverses, at both the high and the low price, a pivot point is created. These pivot points can be connected, forming lines we think of as support and resistance, or the “floor” and “ceiling” of the price. They aren’t precise numbers; they’re the approximate area when particular trader behaviors kick in.
When a stock’s price reaches a resistance level, what’s happening is that there is an abundance of supply accumulating at that level. People are trying to sell because they think this is as high as the stock is going to go. Traders who are “buying low and selling high” are trying to complete their move. Traders who held onto the stock the last time it reached this point and fell are eager to sell now that the price has returned to this point.
Because of these psychological factors, the length of time since the last time the price met resistance is very important. If it was a long time ago, a breakout is more likely to occur because there will be fewer people eager to sell at this price. The closer the last resistance, the more likely resistance is to send the price lower again.
The frequency with which these boundaries are tested also matters. It’s a bad sign for a stock’s chances of moving upward when the support is tested a couple times and then finally sinks below, but it’s a terrible sign if a support level that has been tested many times over a long stretch is finally broken.
When the floor is finally penetrated, the previous floor becomes the new ceiling, and you just have to be patient to see where the new floor will be. Vice versa if the price breaks beyond resistance; the old ceiling becomes the new floor.
The psychology is also flipped on its head in this situation. If resistance has been tested numerous times and the price suddenly breaks through, this is a strong sign. If resistance has only been tested a couple times, then the positive signal is weaker.
Deep declines occur when a stock tests several support areas and the price continues falling through each of them.
10. Breakouts and breakdowns.
A breakout is when a stock’s price moves through a level of resistance. A breakout can occur either out of sideways movement, or as a continuation of an uptrend, or as a reversal of downtrend. The latter two are generally where we see more price expansion. Our goal as traders is to buy just before breakouts occur and sell just before, or while, they slow.
A breakout consists of the following possible segments:
– The leading breakout is when the price exceeds key resistance and heads to a new second-story ceiling. What you’re watching for is the first strong move above resistance, the breakout point. So if you’ve identified resistance as $25.00, you’re looking for the moment when the stock trades at $25.05 or $25.10. Not just when those numbers appear as the ask, but when actual trades are executed at that price. The other component you’re looking for is strong volume. The more people confirming the breakout, the better it’s chances.
– With the price reaching a new high, many traders will start to take profits, and this newly available supply creates a new area of resistance. This is the pullback. When this profit-taking recedes and buyers reenter, another pivot occurs and the price heads upward again, creating another potential entry point, and the safest one. This is also a great opportunity to add to your position if you so choose. The stock now has proven buyers at the new elevated price.
– Sometimes this leads to a secondary breakout where the stock rises above its new resistance and into a new trading range.

Quick aside: Beware of false breakouts around whole numbers, especially round numbers. Traders collectively fall into a psychological trap around these artificial barriers, acting as if these numbers are resistance or support just because it feels right, and a price can sometimes appear to be breaking out over one, only to fall back through a few minutes later.
As you might’ve suspected, breakdowns are the opposite of breakouts. The stock price penetrates its base support level. This is where you short the stock, a process we’ll detail later.
A breakout consists of the following possible segments:
– Inversely parallel to the leading breakout, the breakdown is when the price drops below key support. It could be time to unload the position you’re holding or an opportunity for you to short the stock.
– The stock price might then rally into a pullback as fewer traders make their shares available, believing the actual value of the stock to be higher than the current market price, or at least reluctant to admit it isn’t worth its current price. The bears might soon regain control and push the price further downward. If they do, this is the safest point to short the stock. If you’re holding onto stock and you see the price drop below support again after the pullback, get out fast.
If the market is nearing close for the day and the price drops below support, swing traders might consider selling short here even though there aren’t enough minutes in the trade day left for day traders to seize the shorting opportunity, with the idea that the downward momentum will continue the next day.
If the stock starts trading sideways out of a breakdown, this is a positive sign for the price, and could be indicating that the price is going to pivot upward again.
A word to the wise: Things that go straight up go straight down. Be very wary of skyrocketing stocks.
11. Drawing trending lines
Drawing trending lines is something that needs to become second nature for you, something you do automatically, and more importantly, precisely, and ideally, in your head. If a stock is in a consolidation pattern, simply moving sideways, there’s a little less pressure on drawing lines with accuracy, but when you’re trying to establish trend lines in an upward or downward movement, accuracy is imperative.
Accurately drawn trending lines are an essential tool for a trader. You are determining resistance and support. They will give you excellent stop-loss points. When we draw parallel lines connecting the tops of uptrends and bottoms of downtrends, these provide us with profit-taking and stop-loss points. These are called channel lines.

Once you have accurately drawn trend lines, you want to watch for stock price bouncing off them multiple times. Within the larger context of an uptrend, the greater the number of times the price has bounced off support, the stronger that support is considered to be; more than three times and we call this “highly significant support.” The inverse is true for downtrends and “highly significant resistance,” meaning the price has bounced off the ceiling three or more times. When this highly significant trend lines are broken, they are indicators that the trend may be broken and the price could be reversing course.
The trajectory of a trend angle often shifts rather than completely reversing course, and this needs to be remembered in moments when trend lines are penetrated. Stock price might not be reversing entirely, but you will need to draw new trend lines in order to shore up your understanding of what’s happening with the stock and where your action points are.
Volatility is also a factor. Highly volatile stocks experience errant price strikes that might not stay within the confines of the trend lines you’ve drawn. This complicates things and can cause confusion for novice traders, but with experience you’ll learn to identify these outlier moments.
Uptrends are defined by the continuously rising lows, with new lows never dropping below that of the previous low. When that happens, the trend is broken.
Time frame doesn’t matter. An uptrend is valid at every resolution you look at it.
If the price of a stock dips below an uptrend line where you’ve place your stop, sell. Always. Always obey your stops.
The behavior of stocks trending up at 45 degrees on a daily chart are most favorable for position and swing trades. If the stock is trending up more steeply than 45 degrees, those are great for swing and momentum trades. If a stock is trending upward but closer to horizontal than 45 degrees, consider a longer-term position for slow steady gains, if you determine to stick around at all.
Downtrend lines are drawn the same way as ones for uptrend, connecting the dots between previous high prices and looking for highly significant resistance. If you’re selling short and you see this highly significant resistance line broken, the price rising above the previous high and breaking the trend, it’s time to get out of there.
Chapter 3: Ultimate Day Trading Guide
Purpose of this lesson: We’ll finish looking at the patterns that appear on charts and investigate some of the tools available to use to understand a chart and formulate predictions about what will happen in the future.
1. Chart Patterns for Position Trades
Although we’ll be discussing these patterns in terms of how they apply to position trades, remember this is a fractal blacklight poster that dispenses money and these patterns apply to all time frames.
The nature of your standard-issue breakout is to eventually consolidate until an event like good news jolts the price higher. If the consolidation pattern is orderly and tight, that’s a strong positive sign.
Continuation Patterns
A continuation pattern is a series of horizontal moves during price action. They occur mid-trend and are effectively pauses, consolidations of price, that take place while the stock essentially rests before potentially moving on with the current trend.
You need to be able to recognize the difference between a bona fide consolidation and congestion patterns, which, if you’ll remember from our last lesson, are more choppy and unpredictable. The ability to make this distinction is often the difference between having a fairly good idea of that’s going on and having no idea whatsoever.
Trading in a range is not enough to qualify as consolidation. Consolidation requires a tight, orderly fashion of movement.
The desired effect of consolidation is a building, building, building of tension that will eventually be released, pushing the price back into a trend when volume picks up again, likely in the same direction as the recent trend. The trend doesn’t continue 100% of the time; reversals sometimes happen, and those can be times when you have to take your lumps and shake it off.
Common continuation patterns include triangles, flags, and pennants. These are all pretty user-friendly. You can think of these as the trend catching its breath.
Triangles are called triangles because the converging price range looks like a triangle, which is one of the strongest reasons possible for calling something a triangle. There are three kinds: symmetric, where the two bounds of the pattern move toward each other, ascending, where the lower bound moves upward toward the horizontal upper bound, and descending, where the upper bound slopes downward toward the horizontal lower bound.
A flag develops when the price moves sideways in a small, confined price range that takes the shape of a parallelogram or rectangle. Sometimes the price slopes against the prevailing trend.
A pennant is a smaller version of a symmetrical triangle. If it’s any bigger than about a couple dozen bars, it’s not a pennant, it’s a triangle. This pattern sometimes appears during the lunchtime lull, so in those instances be on the lookout for a potential breakout in a bullish afternoon market.

Reversal Patterns
Reversal patterns are reliable and easy to spot. Learn two or three of these patterns, and learn them well. Keep your game simple and deep.
The double-bottom pattern is one of the most powerful chart patterns, and it works in various ways for all time frames. It looks like a “W” on the chart. The double-top is its inverse, and it looks like an “M.” They represent a stock bouncing against support or resistance multiple times before gaining enough strength to break through. Even more powerful than these are the triple-bottom and triple-top. Those are less common, but because of the added tension and increased likelihood of a strong price move in the trending direction, they are a wonderful thing to find. The more tops and bottoms the better. You’ll often see these patterns when the stock is basing.


A word of caution: Reversals are highly susceptible to false breakouts because they’re so easy to spot. Since they’re obvious to everyone, more people are standing at the ready waiting to jump in as the resistance and support they’ve established are penetrated.
If and when the stock breaks out of the consolidation zone on strong volume, buy half your intended position when the stock trades over resistance and wait. Monitor the volume during the pullback. It should decrease.
If you’re playing it safe, it’s important that pullbacks hold, reverse, and then break above resistance to be playable. If you want to make a play during the reversal day, you’re taking a greater risk, but if your analysis is accurate and you have your stop order set, the additional profit for making the earlier move can be worth it.
When you’re trying to determine which way a stock is going to trend out of consolidation, it’s a positive signal when you see a stock closing the day near the top of its daily candles and a negative signal if they’re closing near the bottom. The stock may break accordingly.
Cup and Handle
The cup and handle is another pattern that can deliver nice profits. Look for this pattern when a stock is basing on daily charts. It resembles the side view of a coffee cup with a rounded bottom and a handle on the right-hand side. Volume should decrease during the decline of the cup and increase during the upward slope of the cup. The handle usually has low trading volume. A longer “U”-shaped cup is what you’re looking for. It’s a stronger signal than a “V”-shaped cup, which we recommend you avoid.

When the pattern is complete, consolidation sends the price into the breakout with some force. On strong volume, buy on consolidation. If volume isn’t definitively strong, buy the first half of your position when the stock trades above resistance and the second half when the pullback reverses.
Which charts should you use?
Most traders select time frames according to their own trade personality. If you prefer making a lot of trades throughout the day, your time frames will be shorter. If you only want to make one or two per day, your time frames might be longer—though they don’t have to be. And many professional traders employ a strategy using both short- and long-term trades. This is why we recommend using a system with two accounts.
Market dynamics apply to all time frames. If the pattern you find on a 5-minute chart isn’t significant on a 60-minute chart, then your system needs revising.
2. Setting Stops
Write your stops down. Write them down. Write. Them. Down. Write. Them down. Write them. Down. Write them down. It’s important to write them down because it’s a stronger psychological check against the part of you that will want to let it slide.
Never risk more than 2% of your account equity on any single trade. This means you need to always keep track of what’s in there and adjust your thinking.
For position and swing trades, a fairly common practice is to place your initial stop-loss order somewhere just below the low of the entry day, from ten cents to no more than a dollar below.
As your stock moves up, trail your stop along with the rising price as it breaks through resistance and establishes new support, probably about fifty cents below, giving yourself some room but preventing you from giving back the profit you’ve already earned.
Channel lines can be drawn after a couple pullbacks during an uptrend, and those channel lines can be used as a warning sign and help you lock in gains using your stops this way. When stock price approaches the resistance of this channel, if it fails to touch it, you might want to consider taking half your position back. You can always buy it back again if the price bounces off support.
Time stops are another option that can be used to close a position. If the price hasn’t been moving in the direction you predicted but also hasn’t touched your stop-loss point, you might not want to wait around for it to slowly deflate. You could reduce your position or use a time stop to get out.
3. Tools of the trade
Traders need to measure current market conditions and forecast trends on the horizon. Indicators are the statistics they use to do so. In the grand scheme of things, economic indicators are metrics used to measure growth and contraction in the economy, whether as a whole or in specific sectors. These figures are used in fundamental analysis that can be used to assess fundamental health of a company for a long-term investment. In a similar way but on a more granular scale, technical indicators are used to predict stock trends and price patterns, useful for looking at the smaller picture and making shorter-term trades.
A technical indicator is a calculation based on the price and volume of a traded asset, used to predict changes in stock trends and price patterns. The two categories of indicators are leading and lagging. One precedes price movements, and the other is a conformation tool following them—can you guess which is which?
Leading indicators are commonly used during periods of sideways movement but not during periods of trending up or down, and lagging indicators are used during both sideways and trending periods.
An oscillator is an indicator bound within a particular range, and they’re the most common type of indicator. The oscillators are designed in such a way that the closer the indicator gets to the extremes defined by the range in either direction, whether the upper or lower limit, the stronger the indication to buy or sell becomes.
Moving averages are very popular lagging indicators that filter out the noise of random price fluctuations and indicate a stock’s strength by taking the average of closing prices during a certain time period.
Volume
Indicators don’t get any simpler than volume. Volume is the count of every transaction occurring during a given period of time, be they for a single stock or a market in its entirety. Volume is used to assess the value of market movements. The higher the volume, the more significant the move.
Volume is found in bar graphs at the bottom of the Level II screen, one bar per candle displayed.

Volume is very important in reading a particular detail that big market players would, if possible, prefer to keep hidden from you. Large brokerage houses like Goldman often need to mask the size of their purchase orders in order to avoid tipping off other players in the market, which would happen if suddenly an enormous order size appeared on every screen paying attention to a particular stock. Every one would follow their lead and gobble up the (currently low-priced) available supply, driving up the price and eating into profit they would otherwise make. So they purchase large orders incrementally, in smaller orders that won’t spook the market. The problem for them is that they can’t hide the total size of the order from the volume bars displayed at the bottom of your screen.
Because volume is one of the few tools traders use that is determined by quantity rather than price, it is uniquely useful in predicting the direction of a market.
Learning to read volume properly takes time. It’s essentially a manifestation of greed, and as with any part of human motivation, it’s complicated, though there are a few natural tendencies associated with it. Volume decreases a bit as price inches up; in order for transactions to occur, some traders have to be willing to sell, and when a stock is becoming more valuable, fewer people are willing to part with it. Volume tends to shrink on consolidation or pullback days, but when you see high volume on those days, be careful—the stock is being sold heavily.
Low volume uptrends are best avoided for the simple reason that they are too volatile to ever know with any certainty whether they’re real or not. Without the support of buyers in high numbers, the price is very likely to fall back down. Despite the natural tendency for volume to decrease a bit as price inches up and fewer traders are willing to sell, ideally you want to see volume rising with a rising price, indicating there will be support for the new higher prices.
A rule of thumb concerning volume is that when volume expands, price expands either higher or lower with it. When volume contracts, price contracts. When volume expands and price doesn’t move, it’s referred to as “price/volume divergence.” You can expect that volume expansion to manifest in an upcoming price movement shortly.
Be aware that although price breakdowns often occur on strong volume, strong volume isn’t necessary for one to happen. Strong volume in these situations only indicates that strong negative feelings are the force driving it downward. A stock price can plummet on minimal volume just as easily given the right negative market conditions.
After a price breakdown, condensed volume should lead to a bounce, but if huge volume accompanies the rally, this is an indication of a reversal of the downtrend.
Look out for massive spikes in volume appearing within the context of an uptrend that appears to be overextended. Surging volume means a reversal could begin soon. What you’re seeing is the exuberance of inexperienced traders chasing stock, accompanied by experienced traders rushing into oblige their eagerness to give their money away. If you see this happening, take your profits and stand by in case the trend gathers steam again, at which point you might consider reentering.
The inverse of this scenario, a large spike in volume during a downtrend, indicates buyers moving in again after watching a stock’s price plummet. The price might simply slow down, but it could also reverse the downtrend entirely, so if you’re short on the stock, get out, if not entirely, at least partially.
Predicting Breakouts or Breakdowns
So how do you know what a stock is about to do before it does it?
For position trades and longer swing trades, look at daily charts and search for a high-quality stock at the bottom of a cycle. The best ones are industry leaders suffering because of sector rotation, their entire industry falling out of favor in the present economic environment. Other candidates are stocks that have fallen due to poor fundamentals at the company, and those fundamentals are now being fixed. Keep monitoring the charts for this stock, and pay attention to the average daily volume. If it begins building or spikes all of a sudden and the corresponding industry index charts look positive, consider taking a long position.
If you’re watching for price breakdowns on position and swing trades, what you want to look for is a stock that has concluded a strong uptrend and has continued moving sideways at what you think could possibly be the top of a the cycle. It should be trading in a range or in a congestion pattern, but not consolidation. Consolidation is a positive sign that the stock’s price will continue to rise. Strong volume across several days where the stock continues moving sideways without consolidating could signal an imminent breakdown.
Volume signals can tell us similar things in shorter time frames. These signals aren’t iron laws, and sometime the price will take a direction contrary to these basic principals, and therein lies one of the great challenges of trading. You should be playing cautiously and stay willing to shrug of the exception that sends a price shooting upward on low volume. Play it safe.
You need to always stay alert for false breakouts. If volume doesn’t spike during a breakout, it’s likely the stock isn’t truly breaking out. Market pros will often test the market by offering supply to see how many buyers are ready to move in.
A stock hitting a new high in an overextended uptrend but with low volume is a stock that’s probably ready to fall. The bulls have abandoned the stock. A shooting star within the context of a stock screaming upward and no volume to support it should immediately lead to you getting out of there.
No volume on the breakout, no trade. That’s the rule for a smart trader protecting their account.
Generally, we would advise you not get involved with stocks that trade fewer than 300k shares per day if you’re thinking about day or momentum trading. For swing trades, no fewer than 100k shares per day. You don’t need this kind of volume for position trading because liquidity is a lesser issue over long periods of time.
Volume is emotion. Strong volume means a breakout or breakdown are driven by strong emotion, so the price will probably push further in the same direction.
The shorter the time frame you’re trading in, the higher the volume you need to see for sufficient liquidity to move in and out when you want.
Moving averages
Moving averages are lagging indicators that use an average of previous price action to suggest what might happen in the future, confirming trends by smoothing out the fluctuations that occur day-to-day. Along with volume, moving averages are your most reliable chart tools. They help you form strong support and resistance zones.
A moving average chart is drawn by averaging the closing prices over a given time period, say the past 20 days, always leaving off the day furthest in the past as we move forward in time, and using the average price across those 20 days to draw a line chart. If this moving average line moves in step with a stock’s trend, the trend is confirmed, and that confirmation is important.
The most frequently used moving averages are the 10-, 20-, 50-, 100-, and 200-period lines.
Moving averages can be used in time frames other than days. A 10-week MA is averaged to draw the closing prices of the last ten Fridays. A 60-min 100 MA chart averages the last 100 closing prices of the corresponding hourly candles. A 5-min 200 MA averages the last 200 closing prices of each 5-min candle. You get the idea.
The MAs with lower numbers hug the price patterns closely as do the MA’s using shorter the time frames.
One of the things you’ll want to get used to early is using different MA lines on different time frames.
Ideally, your direct-access platform will allow you to stack as many MA overlays on your charts as you like. However, it’s usually best to keep it simple. If you work your way up to an absolutely baroque system that no one else could possibly understand, but it works for you, that’s great, but don’t set it as a goal. You’ll probably find yourself stripping away layers, probably down to a single, simple MA during moments of confusion.
How to use Moving Average’s
You’ll use MA’s to finalize your decision to enter a trade. If the stock is behaving as your indicators say it should, enter. If not, don’t.
A moving average is best used with stock that is trending either upward or downward. They lose much of their predictive potency when a stock is moving sideways.
For position and swing trading, stocks that qualify for purchase should be trading above their rising 20 MA, and ideally, above their rising 50 MA.
You want to take long positions on a stock that coasts just above a moving average. A stock in an uptrend on a daily chart bouncing off its 20 or 50 MA in an orderly fashion is one that can probably be timed to the minute when it will bounce, assuming strong volume.
And by “just above,” we mean just that. A stock flying high above the MA, especially the 20 MA, is overextended (“toppy” or “frothy” are terms you might hear referring to this). The stock is likely to take a pullback soon, so wait for it and the confirming bounce before you enter.
The 200-day MA on a daily chart is an exceptionally powerful indicator that provides valuable information in any time frame, and it’s one of the most popular indicators for that reason. Beware of a stock that has fallen below it. This is the sign of a stock with deep, longstanding troubles.
When looking at intraday charts, day traders prefer to see a stock that is bouncing off its rising 200-period MA on a 15-minute chart. 20-period MA on a 5-min chart can also give you strong support areas.
Short sellers are going to move in when price falls beneath support areas and beneath declining moving averages. If you’re looking to short a stock, you want to see a stock trading below its declining 20 MA, and preferably below 50- and 200-day charts as well.
Moving Average Crossovers
The term “golden crosses,” used to refer to moving average crossovers, should give you some idea how valuable they are as signals. A crossover is when a faster moving average intersects with a slower moving average. For example, the 50-day MA could fall below the 200-day MA, or the 20-day MA could rise above the 50-day MA. The signal here is a potential price move, or a continuation of the current move in the direction of whichever is the shorter-term MA.
Alerts for these crossovers can be set on direct-access software platforms.
Momentum Indicators/Oscillators
Momentum indicators tell whether a stock is overbought or oversold and when a stock is potentially ready for a reversal. They’re displayed in scales on your charts, either above or below the price patterns. They include:
Momentum indicators are lagging indicators and are referred to as “oscillators” because they oscillate between high and low readings. If they tell us a stock is overbought or oversold, this means it’s trading above or below recent activity in the price. They’re most appropriately used as decision support gateways, hurdles that need to be quickly cleared before moving in or out of the stock.
An oscillator is an indicator banded between two values and designed to indicate whether a stock is overbought or oversold in the short term. They’re most valuable when a trend isn’t clearly discernible. Oscillators are valuable teammates used alongside other technical analysis indicators but aren’t typically used on their own. Some of these include:
- Stochastics
- CCI (Commodity Channel Index)
- MACD (moving average convergence-divergence oscillator)
- RSI (Relative Strength Index)
- ROC (Rate of Change)
Though oscillators are lagging indicators, they can sometimes be used as leading indicators, because it is generally thought that if they diverge with the direction of the price, the price is likely to soon follow the indicator rather than continue on its divergent path.
Let’s take a closer look at a few of them…
Stochastics
The first powerful momentum indicator we need to look at is called Stochastics, an indicator consisting of two lines that compare the closing price of a stock to a range of its prices over a determined period of time and giving a reading on an oscillating scale from zero to 100. Hugely popular because of its accuracy, it is also known to be temperamental, but the sensitivity can be adjusted. This is done by changing the amount of time used to average the range of prices.
The main line is called the %K line, and it is the faster of the two. The signal line is called the %D line, the slower of the two, and the one we pay closest attention to. The %D line is a moving average of the %K line, and it is the adjustable variable that can improve sensitivity of the oscillator as mentioned above.
When the %D line moves into the overbought position (over 80), traders need to consider selling, and when it swings into the oversold position (under 20), they should consider buying—if the price is moving upward with increased volume.

You can apply Stochastics to any time frame. Try applying it to weekly, daily, and 60-minute charts in order to confirm entries, exits, and risk management decisions.
CCI
The Commodity Channel Index (CCI) is a single-line overbought-oversold oscillator that quantifies the relationship between price, a moving average of price, and normal deviations from that average. It oscillates between zero and 100, measuring a stock’s current price against its statistical mean, the standard default for which being 14 periods.
You can use it for overbought/oversold readings. The signal is overbought when the line rises above +100, telling you to sell, and oversold when the line reads below -100, telling you to buy.
This is another temperamental oscillator, so you’re better off using in longer time frames when you’re trying to confirm setups.

MACD
Moving average convergence divergence (MACD) oscillator, commonly pronounced “mack-dee,” is one of the most popular technical indicators. It’s a steady, less hysterical tool used by investors as well as traders.
The MACD is two lines, the MACD line and a signal line. The MACD line is the “fast” line, its formula being calculated by subtracting the difference between the 12- and 26-period exponential moving averages (EMAs), which are moving averages with extra emphasis given to the most recent price data. The signal line is the “slow” line, calculated on the 9-period EMA of the MACD. It oscillates between upper and lower (+ and -) values, with zero as the median line.

As a stock becomes overbought or oversold, the lines will rise or fall to the extremes respectively. When the MACD line tosses above the signal line, buy. When it crosses below the signal line, sell. It’s a reliable trend-following oscillator, and it can serve you well as a confirmation tool. Try it on weekly, daily, and hourly charts to confirm entry and exit decisions and stay on the right side of a trend. It can also be beneficial as a confirmation to add to open positions. As long as the MACD lines are moving higher or lower, they the indication is a continuation of the trend.
The primary failing of the MACD is that it doesn’t offer any valuable information when a stock is moving sideways.
Our recommendation to you is that MACD, RSI, and continuation and oversold patterns are the basics you should begin with. Don’t move on until you’ve mastered these.
Chapter 4: Ultimate Day Trading Guide
Purpose of this lesson: We’ll provide you with a two week program you can follow, provided you’ve already invested in the office setup you’ll be using, to work your way toward making your first trade. We’re going to teach you how to trade without placing any trades, teach you the habits and processes of trading by subtracting the emotion in order to focus on the mechanics.
You don’t need to be trading hundreds of different stocks. The goal to set for yourself is deep knowledge. Figure out how to play it smart and find grooves in the market that you can use to your advantage. Make it easy as you can on yourself, because the market isn’t going to be easy on you otherwise. Master your tolerance for risk and become comfortable employing a variety of . You’ll develop various aspects of your trading game, but you want to build your style piece by piece.
In preparation for the two week drill, you should have your office set up the way we’ve discussed in the first lesson, including setting up an online broker account and direct-access trade account. Pick out a few stocks you think you might like. You want an actively-traded industry leader or a stock in a hot industry group on the NYSE or Nasdaq.
Narrow it down to a handful and do everything you can to familiarize yourself with their individual personalities. What patterns of behavior can you discern from each? Are they volatile? Easy-going? Get rid of ones that don’t behave in a regular manner or you can’t get a handle on.
Do not trade during the course of these lessons. You don’t HAVE to do these for the entire day, but we recommend you get used to looking at your screen and learning patience and the ability to sit on your hands.
WEEK ONE
Monday.
Establish a morning routine. Do the things that will make you as fresh as possible when you sit down at your desk in the morning. Go for a run. Drink a perfect cup of coffee. Punch a speed bag. Drive a speed boat as fast as it will go. Whatever you think will work. This is just a starting point—It probably won’t work out quite how you think it will. You might not have enough time to do all the things you want, or you might struggle to sustain pieces of the routine over the course of a period of time. This is an evolving process. If your routine isn’t working, reassess the value of each piece and decide whether or not the wind ripping through your hair as you push a boat to life-threatening speeds. If you do, make adjustments, you psycho.
When your morning routine is complete, before you sit down at your desk, turn on the financial news network of your choice and settle on a volume somewhere between “struggling to make the content out” and “can barely think.”
Max out the amount of information about the stock you have displayed on your stream.
Now sit there and watch it all day.
All day.
Take notes on how it’s reacting during the different parts of the trade day that we’ve discussed previously.
That’s it. You’re watching for behavior and learning to sit attentively all day long. This might seem a little boring now, but enjoy it while it lasts, because once you’ve got some skin in the game, it won’t be.
Tuesday.
Now that you’ve spent a day purely looking at behavior, add a layer. Watch the same stock today, but also keep track of the way it behaves in relation to the Dow Jones Industrial Average and S&P 500 Index if your stock is on the NYSE and the NASDAQ Composite if it’s on the NASDAQ. Does its behavior correspond to these indices, or does it follow its own music?
Again, look at how movements in price seem to be influenced by herd behavior at different times of the day. What effect is each particular period of the day having on the price, on the psychology of the traders pushing the price?
Now look for another active stock in your stock’s industry group or sector and pair them on your screen. Watch to see if their movements correspond with each other. Which moves first, your stock or the group?
When the day ends, review the daily charts of the ETFs for your stock’s industry group. What’s happening with them? Are they in uptrends, downtrends, or moving sideways in a range? If they’re moving sideways, are they doing so in congestion or in consolidation?
Try forming resistance and support. What price would you consider a breakout or breakdown?
Look at the individual chart for each you’ve followed your stock. How do the two days compare?
Look at the volume. What is it telling you about why things happened on these days?
Apply 20-, 50-, and 200-day MAs.
Try using Stochastics, CCI, and MACD, or any other oscillator that might interest you. What do they tell you? What happened throughout the day? Are your stocks riding their 20 MA and 50 MA?
Wednesday.
Do everything you did on Tuesday again. You’re trying to internalize the rhythms of the market in general and your stock in particular. Continue familiarizing yourself with everything you looked at yesterday.
Thursday.
Now add another stock. If your first was on the NYSE, pick a NASDAQ stock, and vice versa.
Before the market opens, look at the daily charts of the Dow, the S&P 500, and the NASDAQ Composite. If you don’t have access to those, use their tracking stocks, the Dow Diamonds (DIA), the S&P 500 SPDRS (SPY), and the NASDAQ 100 (QQQQ), which won’t give you every tick but will paint an accurate picture of what’s happening with the price.
Do the same end of the day analysis you’ve been doing. What is the overall market picture?
Friday.
Do the same routine as Thursday with the same stocks. At the end of the day, look at the daily charts for your stocks, their sector indices, and take a look at the Dow and NASDAQ.
Ask yourself what next week will bring. Formulate your expectations, and write them down. Next week, you’ll find out if your were right.
Weekend.
Remember what not staring at a computer screen feels like, and enjoy it.
WEEK TWO
Monday.
Add three more indicators, the TICK, the TRIN, and the E-mini S&P 500 Futures. These market internals help you determine real market health, unveiling a deeper level of truth in the market. The majority of stocks head the direction these leading indicators point to within seconds. Each stock exchange has its own TICK and TRIN.
Many online discount brokers don’t include these indicators, so you may need to obtain these indicators on a subscription basis.
The TICK gives you the number of stocks ticking up minus the number of stocks ticking down that moment. It’s a short-term indicator. If the TICK reads +332, that means 332 more stocks are ticking up than ticking down. It can be kept on your screen on a line chart. If the market starts behaving unpredictably, the TICK’s support and resistance can help you find your way through it.
Stocks behaving strongly on days when the TICK remains in positive territory all morning or afternoon tend to sustain momentum. If the number jumps up to a level around +1000, make note. This means the market is overbought. If it moves beyond +1100, lighten up on any day or momentum trades you have open. The opposite goes for TICK readings under -1100. The market is oversold and probably won’t stay that way. If the TICK is falls below zero, don’t enter intraday trades expecting big breakouts. They tend to fail on days like this.
Today, find out if either of your stocks follow the TICK closely the way large caps like GE, American Express, GM, and Wal-Mart do.
The TRIN (which is an acronym for Trading Index) is sometimes called the “Arms Index” after Richard Arms, who developed it. It measures volatility and tends to be inversely related to the TICK. A low TRIN is a sign that the bulls are running the show.
If you really must know, it’s calculated like this: (Advancing Issues/Declining Issues) / (Advancing Volume/Declining Volume)
Like the TICK, each exchange has its own TRIN. Because of their inverse relationship, there isn’t much sense in keeping the TRIN and TICK for the same exchange open.
Try the TRIN on a 5-min chart today.
TRIN tells you which way volume is flowing, into either advancing or declining stocks. It’s a short-term tool. If the TRIN number is under 1.0, the market is being dominated by advancing stocks. If below 1.0, declining stocks are dominating. So when the TRIN is falling, that’s the sign of a strong market. If it’s rising, the market is getting weaker. Hovering around 1.0 means bulls and bears are struggling to gain control, and that’s the signal for you to stay out of the market. Neither breakouts nor breakdowns are likely to be sustained in such conditions.
Watch the TICK and TRIN together. They usually move in opposite directions. Ideally, you want the TICK above zero and TRIN below 1.0. Only enter short-term trades if this is the case. It will save you a lot of money. The TRIN always wins out over the TICK, so if the TICK says go but the TRIN says no—stay out.
When you see either of the TICK or TRIN at their extremes, it’s probably too good to be true. Stay out.
The E-mini S&P futures are powerful predictors. They’re considered to be highly reflective of public sentiment about the US economy. This is a favorite among traders. The E-mini underlies the “big” S&P contract, which doesn’t display volume the way the E-mini does, and so it has become very popular.
Futures such as the E-mini S&P (ES), are themselves highly liquid commodities. They generally trade in correlation with their cash index, but when they diverge, arbitrageurs return the stock to position. The S&P 500 Index, also referred to the S&P cash, is a benchmark index of 500 large-cap stocks.
Try a 5-min chart of the E-mini S&P futures with a 20-period MA. Use a 3-min chart for momentum and scalping.
If the E-mini takes a dive, be aware of your stops and have them in place. Futures are a very persuasive force, so you might see traders getting out if futures are telling them to do so.
Use these three new indicators in tandem today. On pleasant day, the TICK will stay above zero, the TRIN will stay at 0.9 or below, and the E-mini futures will draw an uptrend with some reasonable pullbacks. If the TICK is erratic and the TRIN stays jacked up over 1.0 and the E-minis are all over the place, remain a spectator until the latter day looks more like the former.
Don’t be afraid to pare back to a single target stock for the day while you get used to watching these new indicators.
Tuesday.
Continue looking at these new indicators from yesterday. If you notice your stock isn’t moving in accordance with what we’ve described above, why do you think that is? Is there some news that’s causing the divergent behavior? Sometimes you come across a stock that has a unique, stubborn character that goes against the grain of the market. If that’s the case, avoid shorter trades until you understand your stock’s personality.
Wednesday.
Now it’s time to start looking at a Level II screen. These are primarily order-entry vehicles, but you should be familiar with the way price volatility appears on these screens.
– Choose an active NYSE stock. Pick one you haven’t looked at before.
– Bring up Level II screen, make sure it includes Time and Sales, and position the screen next to your target stock’s intraday chart.
– Find the index chart of the industry of your target stock and add it.
– Bring up a chart of E-mini S&P futures in the same time frame (preferably 5-min, 15-min, or 60-min charts).
– Bring up your NYSE TICK and TRIN.
That’s your setup for the day as you’ll watch your Level II screen and observe the following:
– Consider the baseline reality that what your screen displays is momentary supply and demand.
– The number of orders stacked up at either bid or ask is called depth, and it shows the current strength or weakness of the price. Price strength means there are more orders at the inside bid relative to the inside ask; price weakness means the opposite, more orders at the ask than the bid. Today, pay particular attention to this dynamic.
– The market becomes bullish as the orders move from the ask to the bid, or from right to left on your screen. The market becomes bearish as the orders move from bid to ask, or left to right. The absence of a clear pattern in either direction means the market is in a state of chaos. See if you can make the distinction between orderly behavior and chaos this way.
– The “Size” column next to the bid and ask column is intended to show how many shares market makers are bidding for and offering out. Intentions can be hidden, and the accuracy of this measure is dubious. Can you spot any instances of market makers attempting to hide the size of their orders?
– “Time & Sales” is where “prints” (the price and lot size for each trade) are listed, underneath the time of day. Prints accompanied by sizable share lots are a more reliable indication of current price direction than the “Size” column. Pay attention to prints of 5000, 10000, and 20000, as these could actually be an order of millions being broken up into pieces before printing, the means big players use for masking large positions. After you’ve satisfied your other criteria for entering a trade, make sure you’re “trading toward size” alongside the big prints. Don’t swim against the tide.
– Green and red are upticks and downticks, not buying and selling, which may be your first intuition. These colors aren’t good indicators of market direction, because a tick could be as small as $0.01.
– Take a look at the bid and ask prices and think about how they work. To “sell at market” is to receive the bid price. To “buy at market” means you pay the ask. If the prints tell you traders are “splitting the bid and the ask,” this means that the specialist might let you buy or sell a stock one or two cents higher or lower than the posted prices.
– When prints tell you stock is being bought at the offer price, and not in-between, it’s a positive indicator, meaning the specialist is demanding retail price and getting it.
– If you really want a stock, pay retail. Otherwise, you might try slipping in a limit order splitting the bid and ask. If you really want it and the order isn’t filled quickly, cancel and buy at the offer price. Same when selling.
– Level II access affords you the ability to monitor your order and gauge the odds of it being filled.
Be sure to keep close tabs on the other indicators as you watch the prints as well.
Thursday.
Today, find a target stock on the Nasdaq with medium volatility and price moving at a reasonable pace. Look at the same things as yesterday, with an emphasis in thinking about the following tips for intraday trading.
– The fun of a Level II order entry system is the opportunity to play market maker yourself. You can buy on the bid and sell on the offer, and you can do it yourself, which saves you the spread.
– One of the things that makes intraday trading so challenging is resisting the urge to chase a stock that breaks over resistance and runs up quickly. Buy at the offer. If it runs up, don’t follow. Don’t bother trying to buy it at the bid.
– If you have an opportunity to post a buy order on a stock breaking out before many other traders take notice, there might be enough selling pressure to place a buy order at the inside bid price or a penny higher and see if you can get it at the bid or the “high bid.”
– You want to sell your position while your stock is still climbing, green prints still filling the Time & Sales, but after you’ve made a nice profit. Post your sell order at the ask price and sell into buying pressure while it still exists. Live by these words of wisdom: “Sell when you can, not when you have to.”
– If you haven’t gotten rid of your position before the stock collapses, don’t bother attempting to sell at the offer. “Hit the bid,” or in an extreme situation, go even lower than the inside bid price.
Friday.
Final day. You’re going to continue on with what you were doing yesterday, adding the TICK and TRIN and watching them interact with your target stock and keeping your eye on the E-mini S&P futures.
Try pulling up another chart of a different time frame for your target stock. Use the same MAs, and watch for similarities between the two during potential breakouts. Keep your eyes on volume and your MAs.
The ability to identify signals across three different time frames is a fundamental skill for executing day trades. In particular, watch out for stocks drifting too high above their 20 MA. They’re overextended and unlikely to move much higher.
Watch your stock bounce off support on intraday charts. Identify support areas formed by consolidation, price reversals, and moving averages.
Watch your stock break through key resistance and pay attention to the role volume plays. How did they signal the breakout beforehand? Were there moments when the price appeared to be breaking out but volume failed to support it? How did market conditions factor into the breakout? Were they deteriorating, and did this cause any breakouts to fail?
Questions for reflection…
Reflect on how you think you would’ve done over the past couple weeks. What don’t you understand clearly? What makes you nervous? Those are the things to focus on before you get started for real.
Impulsiveness, optimism, and stubbornness will be your enemies.
Perfectionism, imperturbability, and methodicalness will be your allies.
Whether or not you succeed will be determined by your ability to perceive accurately. Perception requires honesty, and your capacity for being honest in your judgments of yourself will be crucial. And your intuitions need to be understood and appropriately contextualized. Do you smell a win or a loss? Why?
Chatper 5: Ultimate Day Trading Guide
Purpose of this lesson: We’ll introduce you to a few advanced techniques that can be added what you learned during to the two-week program we laid out for you…
1. Fibonacci numbers
You might already be familiar with what Fibonacci numbers are. The Fibonacci sequence starts with zero, adds one, and then continues adding the last two numbers of the sequence to arrive at the next number, ad infinitum. So: 0, 1, 1, 2, 3, 5, 8, 13, 21, etc…
You might already be familiar with the golden spiral it produces, which recently became an internet meme that reveals how everything is a conspiracy and we are definitely living in the Matrix.
Each Fibonacci number is 1.618 times the preceding Fibonacci number; and so, each Fibonacci number is also 0.618 times the following Fibonacci number. And you are being harvested for your blood, which is the only thing the superior beings distracting your mind with the suffering of life could think of to fuel their batteries.
But they’re also useful for trading purposes.
There are five trading kinds of trading tools based on the Fibonacci sequence:
Arcs. Created by drawing an invisible trend line between the high and low of a given period and drawing three curves intersecting this trend line at the Fibonacci levels of 38.2%, 50%, and 61.8% When the price crosses these levels, those serve as levels of a kind of support or resistance, places where activity is more likely.

Fans. Created by drawing a line between the low and high of a given period and then dividing the vertical distance between the two points by the Fibonacci ratios of 38.2%, 50%, and 61.8%, and then drawing a line through the leftmost point and the points representing these divisions.

Retracements. These are the most popular of these five tools. Horizontal lines are used to indicate support or resistance by dividing the distance between the high and low price in a given period and dividing the difference by the key Fibonacci rations of 23.6%, 38.2%, 50%, 61.8% and 100%

Extensions. Extensions are used to establish retracement beyond 100% of a stock’s previous movement, a popular level being 161.8%. They are most practical to use when price is at a new high or low and there are no clear levels or resistance and support on the chart.

Time Zones. This indicator is used to identify periods during which price will experience significant movement. A starting position is chosen following a major move, and a vertical line is drawn on every day corresponding with a number in the sequence (1, 2, 3, 5, 8, etc.).
Obviously, this can get a bit technical, and trying to keep track of all these different lines can be cumbersome and confusing, but it’s generally advantageous to keep the numbers 2, 3, and 5 at the forefront of your mind. You’ll start to notice them all over your charts. There isn’t a simple reason why, but it will be of benefit to learn to see the role they play in the rhythms of the market.
It has to do with something called the Elliott Wave Theory. During the 1920s, accountant Ralph Nelson Elliott discovered that stock markets, formerly thought to be mostly chaotic activity, actually traded in repetitive cycles.
Stocks in strong uptrends have a tendency to move up three days and pull back for two. They tend to move up for five days and then plateau for three. You’ll see those numbers reversed in strong downtrends. One way this might factor into your thinking is if a stock was moving down for four days, because of the regularity of these numbers, you’re more likely than not to see the trend continue into the fifth day.
Setups to Look For: Swing and Day Trades
“Climbing 20s and 50s”

One of the patterns to recognize and use when executing swing and day trades is the stairs created by 20 MA and 50 MA charts while a stock is in a powerful uptrend. Price behavior becomes somewhat regular during these periods, tending to rise for three days and pull back for two. These numbers aren’t always exact. The range for rising is 2-5 days and 1-5 days for pulling back.
Volume and liquidity permitting, watch the pullback or consolidation for a bounce off the MA that sends the price breaking through resistance on strong volume, and make your entry there. If you’re selling short, look for these same conditions, strong volume on a breakdown bouncing off MA support.

When swing trading, you want to enter as the price starts trading above resistance with strong volume, and after that, as long as the uptrend (or downtrend) stays intact, you can enter and exit near the support and resistance points, but beware of frothy stocks. But once you’re in a trade, you can ride it for two or three days.
For intraday trades, the same setup from the daily chart can be used. When you’re trading in shorter time frames, you want to enter as soon after the break through resistance as possible. In order to accomplish this, as the stock is bouncing off its 20- or 50-day MA, start looking at your 5- and 15-min charts. Sell before the market closes.
CCI provides valuable feedback about bearish divergences that tell you it’s time to take your profits and get out.Look for consolidation patterns. Look for flag patterns. Scan daily charts for stocks in an uptrend, climbing their 20s and 50s, and having pulled back for one or two days. Look at your indicators for signs of a bullish divergences. Another strong sign is if there was strong volume on the prior breakout that subsequently diminished during the period of pullback or consolidation.
Check for candlestick reversal patterns (doji, morning star doji, hammers, bullish piercing patterns) that might predict signs of breaking through resistance.
2. Gap Openings
Understanding why gap openings happen can be complicated. Some reasons include economic reports, industry news, earnings announcements, upgrades and downgrades, and news that affects the stock directly.
“Fading the gap” is a contrarian position traders take against gap openings. Whichever direction the gap I heads, take the other side.
The key to this play is volume. This is one of the rare situations where you don’t want to see volume. Heavy volume means the demand might overcome the shorts and selling pressure and continue moving higher, which is what you’re counting on not happening. Light volume is a sign that the commitment to sustain the higher price isn’t present. Shorting this kind of gap is a great opportunity for momentum trades. Conversely, when a stock gaps down on light volume, that’s a great opportunity for a momentum trade betting the price will increase again.
If your intent is to swing trade—not trying to fade the gap—and a stock gaps open more than 35 cents from its prior close, wait for the price to pull back and reverse. If you want to be extra cautious, wait until it’s trading over the initial intraday high.
If a momentum trade in your intention, you’ll want to pay attention to price for the first 15 minutes and see how much of the gap the stock fills. A strong stock usually fills less of the gap upward than a weak one. But some stocks gap open and burn up all their energy in this initial spike, then they collapse and stay down, and therein lies the hazard of buying the gap open.
The reverse is true for stocks that gap down. The term for a stock that gaps down at open and then recovers is “gap and snap.” If the stock gaps open lower on weak volume, wait for the fill to finish and resistance to exert downward pressure again. This will appear as hanging men, doji, and dark cloud cover on the chart.
If price gaps open higher and remains above the gap for the first hour of trading, that’s a bullish sign. If it remains higher for the entire day and closes near it’s high for the day, odds are it’s going to continue moving higher. And if all this is true and the stock closes over the previous day’s high as well, then those odds are even better.
In candlestick technology, a gap is called a “window.”
As the gap is filled, it’s possible to use Fibonacci retracement lines to identify the support or resistance areas within the gap itself on a 15-min chart.
3. Holding Overnight
We’ve talked about swing trading throughout the course, but swing trading might something you might choose to avoid entirely. It depends on your tolerance for risk. If you do choose to try it, it means you will be holding positions overnight, and that means you’ll be exposed to getting hit with downgrades that occur during non-market hours.
Risk is somewhat alleviated if some of the following criteria are met:
- The stock is part of an industry group in an uptrend as a whole.
- The stock is a leader within its industry group.
- The market is bullish overall.
- The stock is in a strong uptrend, closing at or near its high for the day.
- Your position is small.
Watch closely at the end of the day, and if you want to play it safe, if you catch even a whiff of something fishy with any of the criteria above, either reduce your share size or close the trade entirely. And if the stock gaps open in the morning, sell at least half your position.
When a stock gaps open higher, specialists and market makers get stuck taking the other side of the trade, in effect shorting a stock that is skyrocketing. In order to compensate, their aim is to bring the price down hard after the air goes out of it.
Some people seem to have bad luck holding positions overnight. You may have to take a few lumps before you get the hang it.
A few more notes on mentality
Time frames dictate the different ratios you’ll choose to use in making decisions. Position and swing trades, day trades, momentum trades, and scalping plays all ask you to respond to circumstances in slightly different ways.
In a swing trade, price falling 60 cents might not worry you, but in a day trade, it’s much more likely to stop you out. If you’re making incredibly short intraday trades, your entry price and stop will be less than a point apart.
Your expectation for rewards will also differ across time frames. You’re looking for multiple-point profits in position and swing trades. With day trades, sometimes a point or half point is enough. In a momentum trade or scalp play, a fraction of a point is all you need.
Because of the faster pace, beginners at day trading have a tendency to overtrade. It’s easy to forget that sometimes the trades you don’t make are the most important ones. Protect the money you already have. Trade like a veteran and take your time. Avoid trading when the odds are stacked against you. Cherry-picking the best trades is what savvy trader does, not making as many plays as possible and winning them all. Recognize the conditions and setups that lead to success and only execute those.
What kind of personality does your stock have? Medium- and mild-mannered stocks average somewhere between 25-75 cents when they pull back. More volatile stocks pull back a point or more.
Whenever you’re looking to day trade, go back three days and look at the intraday price action there. This will give you an idea of what to expect in terms of pullbacks. Forming a reasonable expectation will keep you from exiting positions prematurely.
The Average True Range indicator (ATR) determines the average price range of your stock over a certain period of time. If you see the price of your stock approaching the limit suggested by ATR, you might want to consider that there isn’t likely to be much more room for possible upside action.
How to know where your stops belong
Where your stops belong is determined almost entirely by your personal pain threshold. The lower your tolerance, the tighter you’ll want to keep your stops, but the tighter your stops, the more likely you are to get stopped out too quickly and miss out on profits. You don’t have to become a masochist, but in order to maximize your potential for profit, you should develop some tolerance for risk.
The parameters are subjective, but the aim is to set stops far enough from your entry price so that your position has room to grow, but close enough so to prevent a loss that delivers significant damage to your principal.
A not-uncommon scenario would have you placing an initial stop-loss ten to fifteen cents below yesterday’s low. If that’s too rich for your taste, set it ten to thirty cents below support on a 15-min chart. If you’re shorting, the rough equivalent of this would be about ten to fifty cents above resistance.
You need to keep adjusting your stop as the stock achieves new highs, at approximately the current price minus the average pullback for the period.
Keep in mind you don’t have to wait to get stopped out. If the price is nearing resistance, or if it’s losing steam, or you’re nearing a time of day that makes you think it might peter out, consider taking partial profits or closing the position.
Never, ever, never move your stop down. Once you establish it, it can only move up.
What to Look for in Day Trading Setups
Always analyze the price movement of the previous day. This way, if the stock gap opens and circumstances are telling you to stay away, you’ll know. And you’ll also know what to expect in terms of volatility and pullbacks.
Moving averages are useful for providing powerful support and resistance in day trading. Use 20 MA and 200 MA on all your intraday charts for this purpose. For scalping, use 1-min charts and the 10 MA. Develop your own style, but consider adding a 100 MA and possibly a 50 MA. You’re going to have better luck if your stock is riding above its 20 MA, and the 200 MA is exceptionally strong on 15-min charts, notably stubborn against letting price rise above it.
4. Scalps
What is Scalping?
Scalpers move in and out of a stock anywhere between five and several hundreds of times in a single day. They maximize their number of small profits, hoping that in the end they will add up to one large profit.
Scalpers are glued to their monitors all day long, constantly scanning various stocks for tiny moves to capitalize on. High volume is imperative. Without it, the market won’t have the liquidity you need to move in and out quickly. Scalping also requires that you adhere to a strict exit strategy.
There are a few different kinds of scalping. The first, similar to a market maker, is attempting to make a profit off the bid-ask spread by simultaneously posting bids and offers at the same time. It’s incredibly difficult. The profit is tiny. And you have to do it over and over and over.
The second is a more traditional style of trade. The trader buys a very large number of shares in order to generate profit from the very small move in price. The stock must be highly liquid, because you need to move thousands—maybe tens of thousands—of shares very quickly.
The third is the simple employment of a strict 1:1 risk-reward ratio. The scalper enters a position on any signal and exits as soon as it the price moves a predetermined amount in either direction.
The larger the spread, the better. You shouldn’t bother with any stock with a spread less than a penny. One or two cents at an absolute minimum. You won’t be able to cover the commission fees otherwise.
Obviously, finding the lowest possible commission rates is incredibly important for scalpers. You may need to negotiate with your dealer-broker and see what you can do to minimize this cost.
Scalping must be done on a Level II order entry system. Online discount brokers require too many clicks to make a move. It’s an advanced technique. You’re playing against a lot of institutional traders with more experience, money, and quote information than you. When you scalp, you go head-to-head with market professionals who are as unforgiving as any opponent you will ever encounter.
So why would you do it? For one, the risk is limited—you aren’t in a position long enough for it turn sour on you. Your goals are more easily met—if you only need the price to move ten cents, your goal much easier to obtain that a move of a full dollar. This kind of movement happens all the time. Another is that it’s a style of trading that can be done when the whole market is choppy. During those periods, longer positions might be wholly inadvisable. Scalping is a way to supplement the other styles of trading.
Scalping has become much less common since decimalization, because in order to be successful with price movement becoming six time more granular, you need to be capable of sustaining intense focus over long periods of time, executing orders incredibly quickly, and maintaining a vigilant, flexible mindset.
Scalping is about speed and rate of success. Your commissions are going to add up quickly, so you need to be winning more trades.
It’s especially important not too be greedy. Holding out for a mere 5 cents can oftentimes lead to reduced profits.
Scalping presents something of a paradox. It’s arguably the most low-information style of trading, and you might think this would appeal to a novice. It’s mostly mechanics, and that’s what you want to focus on at first, right? But the level of technical mastery it requires to work at the speed and with the sustained vigilance required by scalping is almost always out of the reach of a novice trader.
Stay away from scalping until you’ve become very comfortable with a few other things. This isn’t a technique for beginners. Even after you’ve gained enough experience to venture out and try this, you might choose not to. It takes a specific kind of high-energy personality to trade this way effectively. But there are profits to be had.
Scalper’s Toolbox
Scalpers commonly use a mini-sized Dow, E-mini S&P futures, or E-mini NASDAQ 100 futures as triggers, as well as the TICK and TRIN for NYSE and/or NASDAQ, interpreted along with the mini futures. They also apply Fibonacci retracements to 2- and 5-min mini future charts for support and resistance.
Scalpers also use pivot points, which are support and resistance calculated with a basic formula: the average of the high, low, and closing prices of the previous trade day. The next day, trading above the pivot point indicates bullishness in the overall market, and trading below indicates bearishness.
Daily pivots are the most popular, but they can be plotted from monthly and weekly charts as well, and these are many times added by advanced traders. The basic strategy with pivot points is to wait until a couple 5-min candles close above or below your resistance or support.
Don’t add so many lines to your chart that you confuse yourself or psyche yourself out.
Tick Charts
A tick chart forms candles whenever a designated number of trades take place. Scalpers use them because momentum becomes more readily apparent on them. If candles are appearing quickly, there’s a lot of action in the stock. They’re most useful for stocks with a volume of a million trades or more per day. If there isn’t enough volume to form regular candles throughout the day, the chart won’t tell you much.
50- or 100-tick charts are popular, and some traders use tick charts configured to Fibonacci numbers like 144 or 233.
Scalping Setups
Remember, again: Every chart pattern is applicable to any time frame.
Scalpers most often use the most basic patterns, like consolidations, breakouts and breakdowns, and reversals. Keep in mind that best scalps come during a larger pattern of momentum, and the best scalps are set up by tight consolidation patterns that have been in a tight range for fifteen minutes to a half hour. These patterns tend to emerge in the afternoon on days of solid trending.
In the best setups, the price pattern will ride just above 10- and 20-period MAs, and several narrow-range candles will close at their highs as volume picks up.
Good morning scalps often appear during reversals off support on daily charts.
Timing is always important, and you can buy before the breakout during consolidation if you’ve done your homework and you feel comfortable with your risk-reward analysis. Look for volume, and use indicators like Stochastics or CCI to see if they’re telling you a breakout is imminent. You can also play it a bit more cautiously and buy half your position during consolidation and the rest once the breakout is confirmed.
One-minute charts show a lot of noise, and 2- or 5-minute charts are usually preferred.
If your scalp is on the longer side, don’t wait for weaknesses to make themselves apparent. Sell while the momentum is carrying the price movement. If you leave some money on the table, so be it.
And don’t be embarrassed to paper trade these scenarios until you feel ridiculous about it. This is a high-stress way to trade, so get yourself to a point where you feel over-prepared. You won’t be.
If you try scalping and you enjoy it, stick to a couple stocks and become very familiar with a small number (one or two) before adding too much variety to your repertoire.
Do your homework. Establish your risk-reward analysis before you enter by looking at prior resistance on daily charts as well as 5- and 15-minute charts. If resistance is too close, say, within 75 cents, don’t attempt a scalp. Same with a 200-period MA that tells you the price is about to experience resistance. If resistance level lies less than 75 cents away, find another scalp to target. The best probability scalping setups provide lots of headroom.
S&P futures can signal a downturn that must be heeded. If you’re in the middle of a scalp and you see this happen, you need to exit quickly.
5. Selling Short
To short a stock is to sell a stock with the intention of buying it back later at a lower price.
Here’s how it happens. A broker takes money out of your account. She puts the money in a security deposit. She takes the stock you’ve shorted from another client’s account and leaves them an IOU. If the price falls, you issue an order to buy it back. This is called “covering” the short. The broker then takes the money out of your deposit and buys the shares back at the now-lower price and gives you the difference as profit.
The uptick rule says you can only short a stock on an uptick, never on a downtick. This is done to avoid violent market selloffs. Bigger profits can be made faster off falling stock than rising stock. The panic caused by a downtrend acts like gasoline, burning up the price; this is a stronger force than the greed that pushes prices upward. Specialists and market makers are exempt from this rule because life isn’t fair.
And not all stocks are always available for shorting. The size of the list of shorting candidates is determined by the size of your brokerage firm.
What to Look for on Your Charts
Look for double-top or head-and-shoulders patterns. Check your MAs and be sure the stock is below its 20-day MA. If it’s below its 50-day MA, all the better. Your entry point will be the reverse of what you would normally do going long on a stock.

If you see a price slip below the neckline of a head-and-shoulders pattern, a downtrend is likely. Ideally, higher volume in the left shoulder will be followed by lower volume in the right one. If the higher volume comes in the right shoulder, this is a possible sign of an ensuing uptrend, so watch out. Hold off until the breakdown is confirmed.
After a top reversal, if you see a price skyrocket, that’s a great sign for shorting. The higher they fly, the harder they fall.
When a stock in a downtrend penetrates support, trading one to ten cents below, that’s when it’s time to short.
As always, do your risk-reward analysis before entering a short position. You’ll typically be using 1:2 or 1:3, so look for nearby resistance and use that to calculate your risk price, in the case the one you’ll be “covering” at. Your target profit will be at the previous support, but you’ll want to buy above support so you don’t get caught in a short squeeze, which is when a heavily shorted stock gets pushed upward by all the short sellers trying to cover their position at the same time.
For intraday trading, adjust your risk-reward parameters accordingly. Your stop, which in this case will be around resistance, needs to be near enough to your entry price to protect your principal, and your profit target, which will be near support, should give the price some room to unwind.
Again: Don’t ever, ever move your stop higher for any reason.
Look for a stock in a clear downward trend for the safest shorts. 20- and 50-day MAs should act as resistance as the price steps down. Wait for a rally and short the stock when it weakens.
Look at support levels from the previous day and compare them to the present levels. Where are they suggesting reversals will happen. If support appears to be close, that means a higher risk for your short.
Use your top down criteria in reverse.
Signs that a stock is ripe for a short include: a weak NYSE or NASDAQ, if not overall market; a troubled sector; negative TICK and positive TRIN; E-mini S&P and E-mini NASDAQ 100 futures in negative territory; bearish divergence or downtrend on Stochastics or the CC.
Always pay attention to your shorts. Don’t enter a short position and then take a break unless you have a buy-to-cover stop. A stock can only fall so far, but if you’re being punished for price moving upward, the sky is the limit on the pain you could suffer if you don’t have this stop in place.
Avoid shorting a stock in an uptrend on its daily chart. Stick to those in downtrends or stocks with steady reversal patterns.
Stick to heavily traded stocks when shorting. That means at least 300,000 shares per day.
Don’t try to scalp stocks on the short side until you know you’re ready.
Conclusion: Ultimate Day Trading Guide
Purpose of this lesson: We want to leave you with some advice in the form of a few simple list of things to remember in a few different time frames.
In the coming weeks…
- First of all: paper trade, paper trade, paper trade.
- When you start buying, buy small lots of 100-300 shares per trade.
- Execute only one trade at a time. Complete each trade before you enter the next.
- Similarly, learn one trade technique at a time. Execute it repeatedly and understand it thoroughly before venturing into the next.
- As you move on to new techniques, remember to come back to the ones you’ve learned previously. Stay in practice with each of them. You’re building a foundation of knowledge through experience. Don’t abandon elements and let your trading muscles atrophy.
- Eventually, these techniques will feel like second nature to you. When you’ve got enough experience, you can start mixing trading time frames.
In the moments before you trade…
- What are my reasons for entering this trade?
- What is the present market trend, and does my trade coincide with it?
- Do I have support from primary market indicators?
- Am I getting my entry point exactly right, or could it be more precise?
- What is my game plan? Have I considered it thoroughly and rationally?
- What is my exit price? Write it down or set your stop.
- If this trade performs well, what is my target profit? Write it down, at least at first.
- Is this the right time of day for this trade?
If the answers to these questions check out, you’ve got a green light. Write these down or print them out and post them somewhere near you field of vision to start. They will eventually become an instantaneous reflex, but as a newbie, you need to consciously go through the list.
Do this and soon enough…
- Based on your trade plan, the stock is at the entry point you’ve carefully established.
- You quickly assess the current market conditions.
- Check your gut. Be sure of what you’re doing.
- Point your mouse. Click.
Another useful list of reminders to post near your field of vision:
- Don’t use a mental calculator.
- Don’t think in dollar amounts. Think in numbers.
- Don’t set a specific amount of money you need to make for the day.
- Don’t make trades when the indicators tell you not to.
- Don’t jump in just because you see others doing so.
- Don’t let your self-esteem affect your account balance.
Over the course of your trade career…
- Develop a style. Some people are high-powered assault rifles, firing off as many trades as they can in as short a time as possible, hoping to execute their plan…literally; some people are
- Understand your targets: Let appropriate risk-reward ratios govern your entry and exit points.
- Develop your trade repertoire slowly. Learning to take money out of the market demands patience. It’s going to take a while.
- Lock in. Commit. You don’t have to be the best or the brightest or the quickest. Committing yourself is how you compensate for not being those things, which you definitely won’t be. Even when you feel like you are.
- Set realistic goals. Unrealistic goals aren’t goals, they’re fantasies. You might realize you’re wildest fantasy of drinking the world’s most expensive wine out of a gold-plated Ferrari, but it won’t be because it was a goal you set, it will be the bizarre, demented consequence of setting process-oriented goals. Precision entry/exit trades. Raising your percentage of winning trades. It’s simple, you maniac.
That’s it! No problem, right? We hope you’re walking away from these lessons with a greater understanding of the fundamentals of day trading and a picture of what you need to get started. Day trading is an intense experience. They keys to success are preparation, patience, and capacities for calm and honesty with oneself. What’s working and what isn’t? What do you feel like you don’t understand and how can you build a better understanding?
Break the process of day trading down into its component pieces and master each one of them methodically. Contrary to what movies have conditioned us to expect regarding Wall St., the real masters of day trading don’t set themselves apart by their ruthlessness, but by their ability to see through the fog of their emotions and their ability to change their thinking.
We wish you the best of luck.